1. 确定空间群信息
from pymatgen.core.structure import Structure, Molecule
from pymatgen.symmetry.analyzer import SpacegroupAnalyzer
poscar = Structure.from_file('CONTCAR')
analyzer = SpacegroupAnalyzer(poscar,0.05,5)
print(analyzer.get_space_group_symbol())
print(analyzer.get_space_group_number())
2. 做吸附构型
from pymatgen.core.structure import Structure, Molecule
from pymatgen.core.lattice import Lattice
from pymatgen.ext.matproj import MPRester
from pymatgen.analysis.adsorption import *
from pymatgen.core.surface import generate_all_slabs
from pymatgen.symmetry.analyzer import SpacegroupAnalyzer
from matplotlib import pyplot as plt
from pymatgen.ext.matproj import MPRester
from pymatgen.io.vasp.inputs import Poscar
from pymatgen.io.vasp import Poscar

#---ok
Initial_POSCAR_File="./Initial-POSCAR"
poscar = Poscar.from_file(Initial_POSCAR_File)
IniStructure = poscar.structure
asf_ni_111 = AdsorbateSiteFinder(IniStructure)#创建一个AdsorbateSiteFinder对象。
ads_sites = asf_ni_111.find_adsorption_sites()#然后用AdsorbateSiteFinder找到有可能的吸附位点。
#print(ads_sites)

adsorbate = Molecule("H",[[0,0,0]] )
ads_structs = asf_ni_111.generate_adsorption_structures(adsorbate, repeat=[1, 1, 1])
#--- ok

#fig = plt.figure()
index=0
#for ads_struct in ads_structs:
#    ads_struct.to('NewPOSCAR'+str(index),'poscar')
#    index=index+1
for cry_str in ads_structs:
    Vasp_Str = Poscar(cry_str)
    Vasp_Str.write_file('%dnew.vasp'%index)
    index=index+1
3. 构建POTCAR
# 字典:元素对应的赝势文件路径
base_pseudo_path = '/work/home/liz/vasp_pot/potpaw_PBE/'
pseudo_paths = {
    'H': 'H/POTCAR',
    'Li': 'Li_sv/POTCAR',
    'Be': 'Be_sv/POTCAR',
    'B': 'B/POTCAR',
    'C': 'C/POTCAR',
    'N': 'N/POTCAR',
    'O': 'O/POTCAR',
    'F': 'F/POTCAR',
    'Ne': 'Ne/POTCAR',
    'Na': 'Na_pv/POTCAR',
    'Mg': 'Mg_pv/POTCAR',
    'Al': 'Al/POTCAR',
    'Si': 'Si/POTCAR',
    'P': 'P/POTCAR',
    'S': 'S/POTCAR',
    'Cl': 'Cl/POTCAR',
    'K': 'K_sv/POTCAR',
    'Ca': 'Ca_sv/POTCAR',
    'Sc': 'Sc_sv/POTCAR',
    'Ti': 'Ti_pv/POTCAR',
    'V': 'V_pv/POTCAR',
    'Cr': 'Cr_pv/POTCAR',
    'Mn': 'Mn_pv/POTCAR',
    'Fe': 'Fe_pv/POTCAR',
    'Co': 'Co/POTCAR',
    'Ni': 'Ni_pv/POTCAR',
    'Cu': 'Cu_pv/POTCAR',
    'Zn': 'Zn/POTCAR',
    'Ga': 'Ga_d/POTCAR',
    'Ge': 'Ge_d/POTCAR',
    'As': 'As/POTCAR',
    'Se': 'Se/POTCAR',
    'Br': 'Br/POTCAR',
    'Kr': 'Kr/POTCAR',
    'Rb': 'Rb_sv/POTCAR',
    'Sr': 'Sr_sv/POTCAR',
    'Y': 'Y_sv/POTCAR',
    'Zr': 'Zr_sv/POTCAR',
    'Nb': 'Nb_pv/POTCAR',
    'Mo': 'Mo_pv/POTCAR',
    'Tc': 'Tc_pv/POTCAR',
    'Ru': 'Ru_pv/POTCAR',
    'Rh': 'Rh_pv/POTCAR',
    'Pd': 'Pd/POTCAR',
    'Ag': 'Ag/POTCAR',
    'Cd': 'Cd/POTCAR',
    'In': 'In_d/POTCAR',
    'Sn': 'Sn_d/POTCAR',
    'Sb': 'Sb/POTCAR',
    'Te': 'Te/POTCAR',
    'I': 'I/POTCAR',
    'Xe': 'Xe/POTCAR',
    'Cs': 'Cs_sv/POTCAR',
    'Ba': 'Ba_sv/POTCAR',
    'La': 'La/POTCAR',
    'Ce': 'Ce/POTCAR',
    'Pr': 'Pr_3/POTCAR',
    'Nd': 'Nd_3/POTCAR',
    'Pm': 'Pm_3/POTCAR',
    'Sm': 'Sm_3/POTCAR',
    'Eu': 'Eu/POTCAR',
    'Gd': 'Gd/POTCAR',
    'Tb': 'Tb_3/POTCAR',
    'Dy': 'Dy_3/POTCAR',
    'Ho': 'Ho_3/POTCAR',
    'Er': 'Er_3/POTCAR',
    'Tm': 'Tm_3/POTCAR',
    'Yb': 'Yb_2/POTCAR',
    'Lu': 'Lu_3/POTCAR',
    'Hf': 'Hf_pv/POTCAR',
    'Ta': 'Ta_pv/POTCAR',
    'W': 'W_pv/POTCAR',
    'Re': 'Re_pv/POTCAR',
    'Os': 'Os_pv/POTCAR',
    'Ir': 'Ir/POTCAR',
    'Pt': 'Pt/POTCAR',
    'Au': 'Au/POTCAR',
    'Hg': 'Hg/POTCAR',
    'Tl': 'Tl_d/POTCAR',
    'Pb': 'Pb_d/POTCAR',
    'Bi': 'Bi/POTCAR',
    'Th': 'Th/POTCAR',
    'Pa': 'Pa/POTCAR',
    'U': 'U/POTCAR',
    'Np': 'Np/POTCAR',
    'Pu': 'Pu/POTCAR',
# 添加其他元素和对应的赝势路径
}

for element, relative_path in pseudo_paths.items():
    full_path = f"{base_pseudo_path}{relative_path}"
    pseudo_paths[element] = full_path


# 读取 POSCAR 文件
def read_poscar(poscar_path):
    with open(poscar_path, 'r') as f:
        lines = f.readlines()
        elements = lines[5].split()
        return elements

# 创建大的 POTCAR 文件
def create_big_potcar(elements, pseudo_paths, output_path):
    with open(output_path, 'w') as f_out:
        for element in elements:
            if element in pseudo_paths:
                pseudo_path = pseudo_paths[element]
                with open(pseudo_path, 'r') as f_pseudo:
                    f_out.write(f_pseudo.read())
            else:
                print(f"赝势文件不存在或未定义:{element}")

if __name__ == "__main__":
    poscar_path = "POSCAR"  # 输入文件名
    output_potcar_path = "POTCAR"  # 输出的大 POTCAR 文件名

    elements = read_poscar(poscar_path)
    create_big_potcar(elements, pseudo_paths, output_potcar_path)
    print("大的 POTCAR 文件已创建")
4. 提任务
提到不同节点
for folder in */; do
    if [ -d "$folder" ]; then
        cp pot.py "$folder"
        cd "$folder"
        python pot.py &
        sleep 10
        cd ..
    fi
done
for folder in */;do cp KPOINTS make-pot.py "$folder";cd "$folder";python make-pot.py;sleep 5;cd ..;done
把任务提到一个节点上
for folder in */; do
    # 进入当前文件夹
    cd "$folder"

    # 运行任务
    mpirun -n 48 /home/software/apps/vasp/intelmpi/5.4.4/bin/vasp > vasp.log 2>&1 &

    # 等待当前任务完成
    wait $!

    echo "Task completed in $folder"

    # 返回上级目录
    cd ..
done
5. 批量转换.cif
from pymatgen.core import Structure
from pymatgen.io.vasp.inputs import Poscar
for i in range(0,361,10):
   cif_file = f"{i}.cif"
   vasp_file = f"{i}.vasp"
   structure = Structure.from_file(cif_file)
   vasp_str = Poscar(structure)
   vasp_str.write_file(vasp_file)
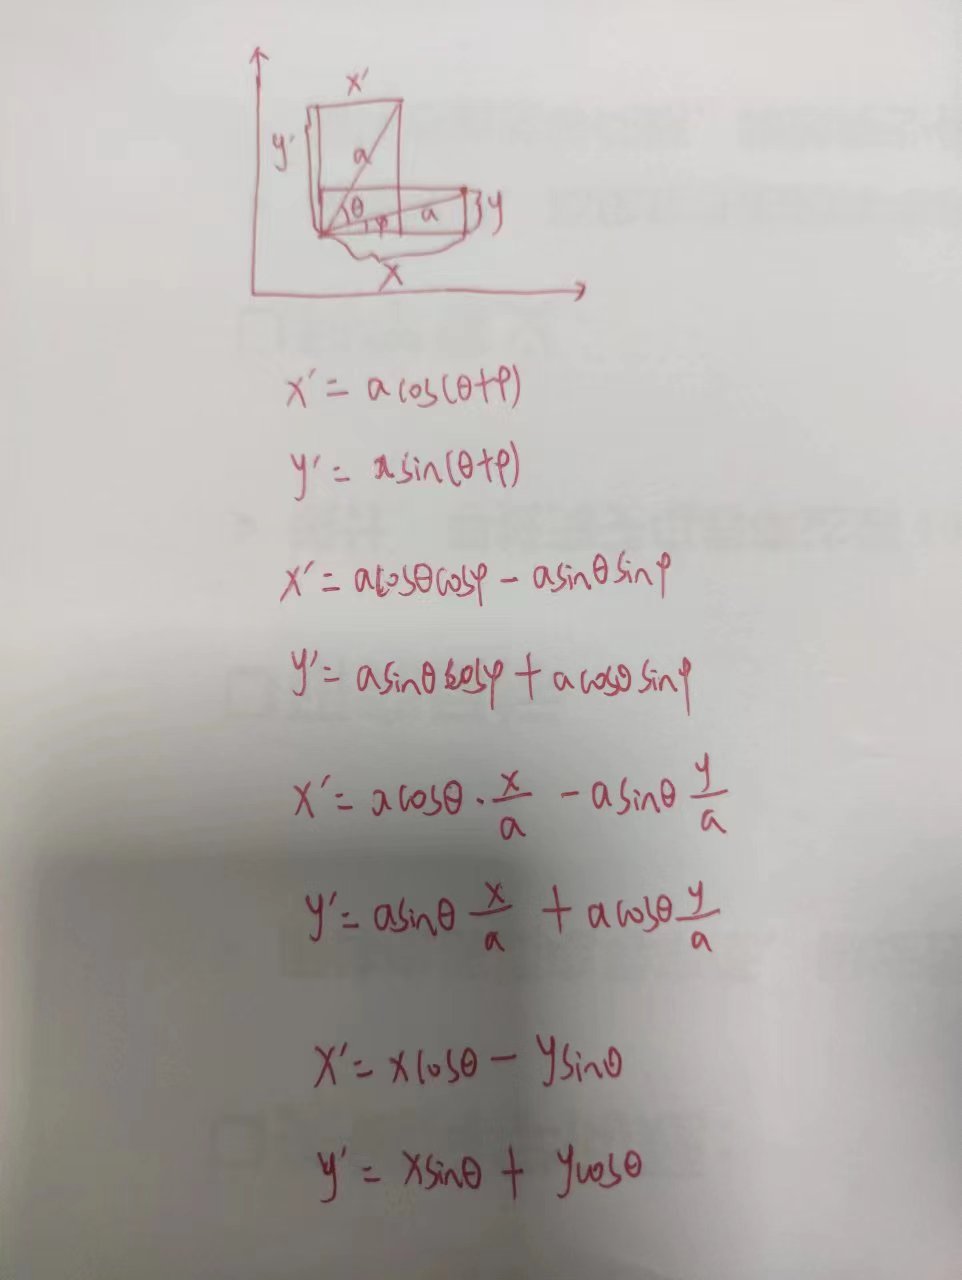
6. 按照自己选定的轴旋转分子
相当于是在ab平面内旋转,应该也可以做成在ac平面或者bc平面的旋转
依据的原理:
import math
import numpy
from pymatgen.core import Structure
from pymatgen.io.vasp.inputs import Poscar

def transform_coordinates(x1, y1,x2,y2, angle):
    x=x2-x1
    y=y2-y1
#    a=math.sqrt(x**2 + y**2)
    # 计算x'
    x_prime = x*math.cos(angle) - y*math.sin(angle)
    # 计算y'
    y_prime = x*math.sin(angle) + y*math.cos(angle)
    aa = math.sqrt(x_prime**2 + y_prime**2)
    return x_prime, y_prime

poscar = Poscar.from_file('POSCAR')
structure = poscar.structure
#设置旋转点
rotation_point = structure[0]
x_coord,y_coord,_= rotation_point.coords
#设置旋转角度/设置每步旋转的角度
ten = math.pi/18
for a in range(1,37):
    m = ten
#设置要旋转的原子的次序
    for atom in structure[1:]:
        x_coord_rotation, y_coord_rotation, _ = atom.coords
        new_x,new_y= transform_coordinates(x_coord,y_coord,x_coord_rotation,y_coord_rotation,m)
        new_x1 = new_x + x_coord
        new_y1 = new_y + y_coord
#注意下面有一个递增的效果,因为是直接修改的原来的坐标
        atom.coords = [new_x1,new_y1,atom.coords[2]]
    new_poscar = Poscar(structure)
    new_poscar.write_file(f"{a}.vasp")
7. 绘制图像
1. 绘制并排图像
python .py file1 fil2 name
import argparse
import matplotlib.pyplot as plt

# 创建命令行参数解析器
parser = argparse.ArgumentParser(description='Plot data from two files.')

# 添加命令行参数选项
parser.add_argument('file1', help='First data file to plot')
parser.add_argument('file2', help='Second data file to plot')
parser.add_argument('title', help='Title for the plot')

# 解析命令行参数
args = parser.parse_args()

# 读取第一个数据文件
data1 = open(args.file1, 'r').readlines()
x1 = [float(line.split()[0]) for line in data1]
y1 = [float(line.split()[1]) for line in data1]

# 读取第二个数据文件
data2 = open(args.file2, 'r').readlines()
x2 = [float(line.split()[0]) for line in data2]
y2 = [float(line.split()[1]) for line in data2]

# 创建两个子图
fig, (ax1, ax2) = plt.subplots(1, 2, figsize=(8, 4))

# 绘制第一个图
ax1.plot(x1, y1, label=args.file1)
ax1.set_title('Plot 1')
ax1.set_xlabel('X-axis')
ax1.set_ylabel('Y-axis')
ax1.legend()
# 绘制第二个图
ax2.plot(x2, y2, label=args.file2)
ax2.set_title('Plot 2')
ax2.set_xlabel('X-axis')
ax2.set_ylabel('Y-axis')
ax2.legend()
# 设置图的标题为传入的参数值
plt.suptitle(args.title)

# 调整子图之间的距离
plt.tight_layout()

plt.savefig(args.title + '.png')
# 显示图形
plt.show()
2. 计算不同百分比斜率
import numpy as np
from scipy import stats

# 读取数据文件并存储数据
data = np.loadtxt('newdata2.txt')

# 定义不同的百分比值
percentages = range(1,100)
print(percentages)

# 针对每个百分比执行线性拟合
for percent_to_select in percentages:
    print (percent_to_select,end=' ')
    # 计算要选择的数据点数量
    num_points_to_select = int(len(data) * percent_to_select / 100)

    # 根据百分比选择数据点
    selected_data = data[:num_points_to_select]

    # 线性拟合并计算斜率
    x = selected_data[:, 0]  # 假设第一列是 x 值
    y = selected_data[:, 1]  # 假设第二列是 y 值

    # 执行线性回归拟合
    slope, intercept, r_value, p_value, std_err = stats.linregress(x, y)

    # 输出斜率
    print (slope)
print()
3.根据log.lammps处理得到能量、势能的变化
import matplotlib
matplotlib.use('Agg')  # 使用非图形化的Agg后端

import matplotlib.pyplot as plt
import numpy as np

# 从.dat文件中读取数据
data = np.genfromtxt('log.dat', delimiter=None, skip_header=1)

x = data[:, 1]  # 第二列作为x轴
y1 = data[:, 2]  # 第三列作为第一组y值
y2 = data[:, 3]  # 第四列作为第二组y值
y3 = data[:, 4]  # 第五列作为第三组y值

# 创建三个子图
fig, axes = plt.subplots(1, 3, figsize=(15, 5))

# 绘制第一个图
axes[0].plot(x, y1, label='Column 3')
axes[0].set_title('Plot 1')
axes[0].set_xlabel('X-axis')
axes[0].set_ylabel('Y-axis')
axes[0].legend()

# 绘制第二个图
axes[1].plot(x, y2, label='Column 4')
axes[1].set_title('Plot 2')
axes[1].set_xlabel('X-axis')
axes[1].set_ylabel('Y-axis')
axes[1].legend()

# 绘制第三个图
axes[2].plot(x, y3, label='Column 5')
axes[2].set_title('Plot 3')
axes[2].set_xlabel('X-axis')
axes[2].set_ylabel('Y-axis')
axes[2].legend()

# 保存为all.png
plt.tight_layout()
plt.savefig('all.png')
8.根据需要直接求出斜率
python 文件名 百分比
import argparse
import numpy as np
from scipy import stats

# 创建命令行参数解析器
parser = argparse.ArgumentParser(description='Perform linear regression on data.')

# 添加命令行参数选项
parser.add_argument('file', type=str, help='Data file name', default='a.dat')
parser.add_argument('percent', type=float, help='Percentage of data to use for regression', default=80)

# 解析命令行参数
args = parser.parse_args()

# 1. 读取数据文件并存储数据
data = np.loadtxt(args.file)

# 2. 选择指定百分比的数据点
percent_to_select = args.percent
num_points_to_select = int(len(data) * percent_to_select / 100)
selected_data = data[:num_points_to_select]

# 3. 线性拟合并计算斜率
x = selected_data[:, 0]  # 假设第一列是 x 值
y = selected_data[:, 1]  # 假设第二列是 y 值

# 执行线性回归拟合
slope, intercept, r_value, p_value, std_err = stats.linregress(x, y)

# 输出斜率
print(f"斜率: {slope}")
2. 同一条轨迹的不同百分比
import numpy as np
from scipy import stats
import math
# 读取数据文件并存储数据
data = np.loadtxt('msd.dat')

# 定义不同的百分比值
percentages = range(1,101)
print(percentages)

# 针对每个百分比执行线性拟合
for percent_to_select in percentages:
    print (percent_to_select,end=' ')
    # 计算要选择的数据点数量
    num_points_to_select = int(len(data) * percent_to_select / 100)

    # 根据百分比选择数据点
    selected_data = data[:num_points_to_select]

    # 线性拟合并计算斜率
    x = selected_data[:, 0]  # 假设第一列是 x 值
    y = selected_data[:, 4]  # 假设第二列是 y 值

    # 执行线性回归拟合
    slope, intercept, r_value, p_value, std_err = stats.linregress(x, y)

    # 输出斜率
    print (slope,end=' ')
    D= slope*1000/60000
    print(D,end=' ')
    logD = math.log10(D)
    print(logD)
print()
9. 把一个不带对称性的cif写成标准的带空间群和wycoff posion的cif
可以自己手动改写,找到空间群后手动改写
Wyckoff Positions of Space Groups (ehu.es)
这个网站找对称性,注意小数点后输入至少5位
可能存在一个wycoff positon有两个点占用的情况,需要一个一个手动来做
10.处理POSCAR
"""
输入可以有多种形式,输出目前只有writ_poscar可以
"""


import numpy as np
def read_poscar(filename):
    with open(filename,'r') as file:
        lines =file.readlines()
    title =lines[0].strip()
    scale =float(lines[1].strip())
    #for i in range(2,5):
    #    lattice_list.append(list(map(float,line[i].split())))
    #lattice_array=np.array(lattice_list)
    lattice_vectors = np.array([list(map(float,lines[i].split())) for i in range(2,5)])
    element_type=lines[5].split()
    atomnumbers=np.array(list(map(int,lines[6].split())))
    atompositions=np.array([list(map(float,lines[i].split())) for i in range(8,8+sum(atomnumbers))])
    cor_type = lines[7].strip()
    if cor_type.lower() == "direct" or cor_type.lower() == "d":
        atompositions[atompositions < 0]+=1
        atompositions[atompositions >=1]-=1
    elif cor_type.lower() == "cartesian" or cor_type.lower() == "c":
        pass
    return(title,scale,lattice_vectors,element_type,atomnumbers,cor_type,atompositions)
def write_poscar(filename,title,scale,lattice_vectors,element_type,atomnumbers,cor_type,atompositions):
     with open(filename,'w') as file:
        file.write(f"{title}\n")
        file.write(f"{scale}\n")
        for vec in lattice_vectors:
            file.write(f"{vec[0]:.8f}  {vec[1]:.8f}  {vec[2]:.8f}\n")
        #"  ".join用于将可迭代对象的元素以空格连接起来
        file.write("  ".join(element_type)+ "\n")
        file.write("  ".join(map(str,atomnumbers))+ "\n")
        file.write(f"{cor_type}\n")
        for pos in atompositions:
            file.write(f"{pos[0]:.8f}  {pos[1]:.8f}  {pos[2]:.8f}\n")

#输出不同类型原子的坐标
def atom_pos(atomnumbers,atompositions):
    atom_pos = np.split(atompositions,np.cumsum(atomnumbers)[:-1])
    return atom_pos

"""
功能区
"""
#计算体积
def cal_volume(lattice_vectors):
    volume = np.abs(np.dot(lattice_vectors[0],np.cross(lattice_vectors[1],lattice_vectors[2])))
    return volume


#转换分数坐标为笛卡尔坐标
def change_dir_to_car(filename):
    title,scale,lattice_vectors,element_type,atomnumbers,cor_type,atompositions= read_poscar(filename)
    if cor_type.lower() == "cartesian" or cor_type.lower() == "c":
        pass
    elif cor_type.lower() == "direct" or cor_type.lower() == "d":
        atompositions = np.dot(atompositions,lattice_vectors)
        cor_type = "Cartesian"
    return title,scale,lattice_vectors,element_type,atomnumbers,cor_type,atompositions
#笛卡尔坐标转换为分数坐标
def change_car_to_dir(filename):
    title,scale,lattice_vectors,element_type,atomnumbers,cor_type,atompositions = read_poscar(filename)
    if cor_type.lower() == "cartesian" or cor_type.lower() == "c":
        atompositions = np.dot(atompositions,np.linalg.inv(lattice_vectors))
        cor_type = "Direct"
        atompositions[atompositions < 0]+=1
        atompositions[atompositions >=1]-=1
    elif cor_type.lower() == "direct" or cor_type.lower() == "d":
        pass
    return title,scale,lattice_vectors,element_type,atomnumbers,cor_type,atompositions

#晶格向量的变换
def lattice_change(filename,cell_type):
    title,scale,lattice_vectors,element_type,atomnumbers,cor_type,atompositions= change_car_to_dir(filename)
    if cell_type == '211':
        pass
    elif cell_type == "121":
        middle_value = lattice_vectors[0].copy()
        lattice_vectors[0] = lattice_vectors[1]
        lattice_vectors[1] = lattice_vectors[2]
        lattice_vectors[2] = middle_value
        middle_value2 = atompositions[:,0].copy()
        atompositions[:,0] = atompositions[:,1]
        atompositions[:,1] = atompositions[:,2]
        atompositions[:,2] = middle_value2
    elif cell_type == "112":
        middle_value = lattice_vectors[0].copy()
        lattice_vectors[0] = lattice_vectors[2]
        lattice_vectors[2] = lattice_vectors[1]
        lattice_vectors[1] = middle_value
        middle_value2 = atompositions[:,0].copy
        atompositions[:,0] = atompositions[:,2]
        atompositions[:,2] = atompositions[:,1]
        atompositions[:,1] = middle_value2
    return title,scale,lattice_vectors,element_type,atomnumbers,cor_type,atompositions
#将211晶胞分解为两个111晶胞
def split_211(input_file,cell_type,output_file1,output_file2):
    title,scale,lattice_vectors,element_type,atomnumbers,cor_type,atompositions= lattice_change(input_file,cell_type)
    atom_type_pos = atom_pos(atomnumbers,atompositions)
    total_atoms1 = []
    total_atoms_number1 = []
    total_atoms2 = []
    total_atoms_number2 = []
    if cor_type.lower() == "direct" or cor_type.lower() == "d":
        for sub_atom_type_pos in atom_type_pos:
            print(sub_atom_type_pos)
            coord_1=sub_atom_type_pos[sub_atom_type_pos[:,0]<=0.48].copy()
            total_atoms1.append(coord_1)
            total_atoms_number1.append(len(coord_1))
            coord_2=sub_atom_type_pos[sub_atom_type_pos[:,0]>0.52].copy()
            total_atoms2.append(coord_2)
            total_atoms_number2.append(len(coord_2))
    # elif cor_type.lower() == "cartesian" or cor_type.lower() == "c":

    #     for sub_atom_type_pos in atom_type_pos:
    #         sub_atom_type_pos=np.dot(sub_atom_type_pos,np.linalg.inv(lattice_vectors))
    #         sub_atom_type_pos[sub_atom_type_pos < 0]+=1
    #         sub_atom_type_pos[sub_atom_type_pos >=1]-=1
    #         coord_1=sub_atom_type_pos[sub_atom_type_pos[:,0]<=0.5].copy()
    #         total_atoms1.append(coord_1)
    #         total_atoms_number1.append(len(coord_1))
    #         coord_2=sub_atom_type_pos[sub_atom_type_pos[:,0]>0.5].copy()
    #         total_atoms2.append(coord_2)
    #         total_atoms_number2.append(len(coord_2))
    #     cor_type = "Direct"
    total_atoms1=np.vstack(total_atoms1)
    total_atoms2=np.vstack(total_atoms2)
    total_atoms1=np.dot(total_atoms1,lattice_vectors)
    total_atoms2=np.dot(total_atoms2,lattice_vectors)
    lattice_vectors[0]/=2
    cor_type ="Cartesian"
    # print(total_atoms1)
    # print(total_atoms_number1)
    write_poscar(output_file1,title,scale,lattice_vectors,element_type,total_atoms_number1,cor_type,total_atoms1)
    write_poscar(output_file2,title,scale,lattice_vectors,element_type,total_atoms_number2,cor_type,total_atoms2)

#POSCAR坐标的修改
def coords_change(axis,value,cor_type,atompositions):
    if cor_type.lower() == "Cartesian" or cor_type.lower() == "c":
        print("use change_car_to_dir to input")
    elif cor_type.lower() == "direct" or cor_type.lower() == "d":
        if axis == 'x':
           atompositions[:,0] += value
        elif axis == 'y':
           atompositions[:,1] += value
        elif axis == 'z':
           atompositions[:,2] += value
        else:
            raise ValueError(f"invalid axis")
    else:
        raise ValueError(f"invalid cor_type")
    return atompositions
11. 处理XDATCAR
#只适用于NVT模拟
import numpy as np
def read_xdatcar(filename):
    with open (filename, 'r') as file:
        lines = file.readlines()
        title=lines[0].strip()
        scale=float(lines[1].strip())
        lattice_vectors=np.array([list(map(float,lines[i].split())) for i in range(2,5)])
        element_type=lines[5].split()
        atom_numbers=np.array(list(map(int,lines[6].split())))
        total_atom=np.sum(atom_numbers)
        cor_type = lines[7].split()[0]
        if cor_type.lower()=="direct" or "d":
            step_positions =[]
            for i in range(7,len(lines),total_atom+1):
                atompositions=np.array([list(map(float,lines[j].split())) for j in range(i+1,i+1+total_atom)])
                step_positions.append(atompositions)
        else:
            raise ValueError("unknown coordinate type!")
        #序号是从0开始,第一个序号对应的结构是1
        step_positions=np.array(step_positions)
        return title,scale,lattice_vectors,element_type,atom_numbers,cor_type,step_positions
def unwrap_xdatcar(filename):
    title,scale,lattice_vectors,element_type,atom_numbers,cor_type,step_positions=read_xdatcar(filename)
    total_atom=np.sum(atom_numbers)
    all_step=len(step_positions)
    for i in range(1,all_step):
        for j in range(total_atom):
            if step_positions[i][j][0]-step_positions[i-1][j][0]>=0.5:
                for k in range(i,all_step):
                    step_positions[k][j][0]-=1
            elif step_positions[i][j][0]-step_positions[i-1][j][0]<-0.5:
                for k in range(i,all_step):
                    step_positions[k][j][0]+=1
            if step_positions[i][j][1]-step_positions[i-1][j][1]>=0.5:
                for k in range(i,all_step):
                    step_positions[k][j][1]-=1
            elif step_positions[i][j][1]-step_positions[i-1][j][1]<-0.5:
                for k in range(i,all_step):
                    step_positions[k][j][1]+=1
            if step_positions[i][j][2]-step_positions[i-1][j][2]>=0.5:
                for k in range(i,all_step):
                    step_positions[k][j][2]-=1
            elif step_positions[i][j][2]-step_positions[i-1][j][2]<-0.5:
                for k in range(i,all_step):
                    step_positions[k][j][2]+=1
    return title,scale,lattice_vectors,element_type,atom_numbers,cor_type,step_positions

def write_xdatcar(filename,title,scale,lattice_vectors,element_type,atom_numbers,cor_type,step_positions):
    with open (filename,"w") as file:
        file.write(f"{title}\n")
        file.write(f"{scale}\n")
        for vec in lattice_vectors:
            file.write(f"{vec[0]:.8f}  {vec[1]:.8f}  {vec[2]:.8f}\n")
        file.write("  ".join(element_type)+ "\n")
        file.write("  ".join(map(str,atom_numbers))+ "\n")
        for i in range(len(step_positions)):
            file.write(f"Direct configuration= {i+1}\n")
        #这里的等号必须紧挨着tion,不然会报错
            for pos in step_positions[i]:
                file.write(f"{pos[0]:.8f}  {pos[1]:.8f}  {pos[2]:.8f}\n")

"""
功能区
"""
#输出某一帧作为POSCAR
def write_step(step_number,filename_output,title,scale,lattice_vectors,element_type,atom_numbers,cor_type,step_positions):
#x是帧数
    step_number =step_number-1
    with open (filename_output,"w") as file:
        file.write(f"{title}\n")
        file.write(f"{scale}\n")
        for vec in lattice_vectors:
            file.write(f"{vec[0]:.8f}  {vec[1]:.8f}  {vec[2]:.8f}\n")
        file.write("  ".join(element_type)+ "\n")
        file.write("  ".join(map(str,atom_numbers))+ "\n")
        file.write(f"{cor_type}\n")
        for pos in step_positions[step_number]:
            file.write(f"{pos[0]:.8f}  {pos[1]:.8f}  {pos[2]:.8f}\n")

# 求x原子每步移动的距离
def diff_atom_positio(step_positions_unwrapped,atom_number):
#unwrapped step positions来源于unwrap_xdatcar
#x是第几个原子
    atom_number=atom_number-1
    all_step=len(step_positions_unwrapped)
    diff_vector=[]
    for i in range(all_step):
        if i <= all_step-2:
            print(i)
            diff_vector.append(step_positions_unwrapped[i+1][atom_number]-step_positions_unwrapped[i][atom_number])
    diff_vector=np.array(diff_vector)
    diff_distance=np.sqrt(np.sum(diff_vector**2,axis=1))
    return(diff_distance,diff_vector)
12.计算距离矩阵
from pymatgen.core import Structure
import numpy as np
import os
lowest_distance =[]
for i in range(0,70000):
    print(i)
    filename=f"{i}.vasp"
    if os.path.exists(filename):
        structure = Structure.from_file(filename)
        na_indices = [i for i, site in enumerate(structure) if site.specie.symbol == "Na"]
# 初始化距离矩阵
        na_count = len(na_indices)
        distance_matrix = np.zeros((na_count, na_count))

# 计算钠原子之间的距离
        for i in range(na_count):
            for j in range(i + 1, na_count):
                distance = structure.get_distance(na_indices[i], na_indices[j])
                distance_matrix[i, j] = distance
                distance_matrix[j, i] = distance
        np.fill_diagonal(distance_matrix, 10)
        print(np.min(distance_matrix))
        lowest_distance.append(np.min(distance_matrix))
    else:
        continue

lowest_distance =np.array(lowest_distance)
np.savetxt('distance.txt',lowest_distance)
13.使用pymatgen
1. 查看元素u值
from mp_api.client import MPRester
from pymatgen.core import composition
from pymatgen.io.vasp.outputs import Vasprun
from pymatgen.analysis.phase_diagram import PhaseDiagram, PDPlotter, PDEntry
from pymatgen.entries.compatibility import MaterialsProject2020Compatibility
from pymatgen.core import Element
from pymatgen.io.vasp import Poscar


poscar = Poscar.from_file("./POSCAR")
structure = poscar.structure

mpr=MPRester("5BhZJctjosrFpkuE6qErpu85dT4gw4VZ")
#vasprun = Vasprun('vasprun.xml', parse_potcar_file=False)
#elements = list(vasprun.final_structure.composition.elements)
elements = list(structure.composition.elements)
element_symbols = [element.symbol for element in elements]
element_symbols = [element_symbols[1],"O"]
mp_entries = mpr.get_entries_in_chemsys(elements=element_symbols, additional_criteria={"thermo_types": ["GGA_GGA+U"]})

filtered_entries = []
for entry in mp_entries:
    # 获取当前条目的元素组成
    entry_elements = list(entry.composition.elements)
    entry_element_symbols = [element.symbol for element in entry_elements]

    # 检查是否只包含指定的两种元素
    if set(entry_element_symbols) == set(element_symbols):
        filtered_entries.append(entry)

entry1 = filtered_entries[-1]
print(entry1.composition)
parameters = entry1.parameters
if "hubbards" in parameters:
    hubbards = parameters["hubbards"]
    print(f"Hubbard U values: {hubbards}")
else:
    print("This calculation does not use Hubbard U (likely GGA only).")
2.计算体积值
from pymatgen.core import Structure

structure = Structure.from_file("POSCAR")
volume = structure.volume

print(f"{volume}")
3. 修改POSCAR中元素顺序
import os
from pymatgen.core import Structure
from pymatgen.io.vasp import Poscar

def change_position(poscar_path):
    """修改 POSCAR 文件中的元素顺序并保存修改后的文件"""
    structure = Poscar.from_file(poscar_path).structure

    # 重新排序元素
    new_element_order = ["Na", "Y", "Si", "O"]
    structure = structure.get_sorted_structure(
        key=lambda site: new_element_order.index(site.species.elements[0].symbol)
    )

    # 写入新的 POSCAR 文件
    new_poscar_path = os.path.join(os.path.dirname(poscar_path), "POSCAR_modified")
    new_poscar = Poscar(structure)
    new_poscar.write_file(new_poscar_path)
    print(f"Modified POSCAR saved as {new_poscar_path}")

# 遍历当前目录的所有子目录,查找并修改 "poscar" 文件
root_dir = os.getcwd()  # 当前目录
for subdir, _, files in os.walk(root_dir):
    for file in files:
        if file.lower() == "poscar":  # 兼容大小写
            poscar_path = os.path.join(subdir, file)
            print(f"Processing {poscar_path} ...")
            change_position(poscar_path)
4. 扩胞
from pymatgen.io.vasp import Poscar

poscar = Poscar.from_file("POSCAR")

supercell = poscar.structure * [3, 3, 3]

poscar = Poscar(supercell)
poscar.write_file("POSCAR333.vasp")
14. 处理不同温度MSD得到离子电导率
import numpy as np
import matplotlib.pyplot as plt
from scipy.stats import linregress
import matplotlib
matplotlib.use('Agg')

def dealMSD(inputfile):
    data = np.loadtxt(inputfile,skiprows = 1 )
    data[:,0] = data[:,0] / 1000
    n = data.shape[0]
    start_idx = int(n*0.05)
    end_idx = int(n*0.95)
    time = data[start_idx:end_idx,0]
    MSD = data[start_idx:end_idx,4]
    slope, intercept, r_value, _, _ = linregress(time, MSD)
    MSD_fit = slope * time + intercept


    fig,ax1 = plt.subplots(figsize=(4,3),dpi = 600)
    ax1.plot(data[:, 0], data[:, 4],
            linewidth=2,          # 更粗的线条
            color='#2ecc71',      # 柔和的绿色
            alpha=0.8)
    ax1.plot(time, MSD_fit, label=f'Fit: y = {slope:.2f}x + {intercept:.2f}', color='red')
    ax1.set_xlabel('t (ps)')
    ax1.set_ylabel(r'MSD ($\AA^2$)')
    ax1.legend()
    ax1.grid(True)
    output_filename = inputfile.replace('/','-') + '.png'
    plt.savefig(output_filename, bbox_inches='tight')
    plt.close()
#    plt.show()
    return slope


diffD = []
temp = [600, 800,1000]
for i in temp:
    inputfile = f"{i}/msd/MSD.dat"
    try:
        slope = dealMSD(inputfile)
        diffuD = slope / 60000
        diffD.append(diffuD)
    except FileNotFoundError:
        print(f"文件 {inputfile} 不存在")
        diffD.append(0)
logdiffD = np.log10(diffD)
temp_inv = np.array([1000 / i for i in temp])


slope_D, intercept_D, _, _, _ = linregress(temp_inv, logdiffD)

temp_inv_fit = np.linspace(1, 3.3, 100)
logDfit = slope_D * temp_inv_fit + intercept_D
#logDfit = slope_D * temp_inv + intercept_D
fig,ax1 = plt.subplots(figsize=(4,3),dpi = 600)
ax1.plot(temp_inv_fit, logDfit, label=f'Fit: y = {slope_D:.2f}x + {intercept_D:.2f}', color='red')
ax1.scatter(temp_inv, logdiffD,color = 'blue',marker = 'o')
ax1.set_xlabel('1000/T (1/K)')
ax1.set_ylabel(r'log10(D) (Å$^2$/ps)')
ax1.set_xlim(0.9, 3.5)
ax1.set_ylim(slope_D * 3.5 + intercept_D, slope_D * 0.9 + intercept_D+ 0.3)

y_min = slope_D * 3.5 + intercept_D
y_max = slope_D * 0.9 + intercept_D + 0.3
y_ticks = np.arange(np.floor(y_min / 0.5) * 0.5, np.ceil(y_max / 0.5) * 0.5, 0.5)
ax1.set_yticks(y_ticks)

ax1.legend()
ax1.grid(True)
# plt.savefig('arrnius.png',bbox_inches='tight')


from pymatgen.core import Structure
structure = Structure.from_file("POSCAR")
volume = structure.volume
atomsnumber = 30
Eanumber = 0.198691478
T = 300
logD300 = slope_D * (1000 / T) + intercept_D
D = 10 ** logD300

sigma300 = 1.858 * atomsnumber / volume / 300 * (10**12) * D
Ea = -Eanumber * slope_D

print(Ea, sigma300)


text_str = f'Ea = {Ea:.2f}  eV\nSigma300K = {sigma300:.2f} mS/cm'
ax1.text(0.95, 0.95, text_str, transform=ax1.transAxes,
         fontsize=10, verticalalignment='top', horizontalalignment='right',
         bbox=dict(facecolor='white', alpha=0.8, edgecolor='black'))

# 保存图像
plt.savefig('arrhenius.png', bbox_inches='tight')  # 修正拼写
plt.close()
转载请注明来源 有问题可通过github提交issue