1.绘图脚本(相图、巨势相图)
使用material project数据库中的数据要求赝势和mp数据库一致,如果有磁性要求U值也一致。否则在MaterialsProjectCompatibility() 后会输出为none
检查为什么是none
from pymatgen.entries.compatibility import MaterialsProjectCompatibility

# 检查原始条目
print("原始条目:", entry_vasp)
print("结构:", entry_vasp.structure)
print("成分:", entry_vasp.composition)
print("能量:", entry_vasp.energy)

# 处理条目并调试
compatibility = MaterialsProjectCompatibility(check_potcar_hash=False)
entry_from_vasp = compatibility.process_entry(entry_vasp)
if entry_from_vasp is None:
    print("处理失败,原因:", compatibility.get_explanation_dict(entry_vasp))
else:
    print("处理后结果:", entry_from_vasp)
查看material project中使用的u值
from mp_api.client import MPRester

# 用你的 API 密钥替换 "your_api_key"
with MPRester("your_api_key") as mpr:
    # 查询特定材料,例如 Fe2O3 (mp-565814)
    material_id = "mp-565814"  # Fe2O3 的 Materials Project ID
    entry = mpr.get_entry_by_material_id(material_id)

    # 检查计算参数中的 hubbards
    parameters = entry.parameters
    if "hubbards" in parameters:
        hubbards = parameters["hubbards"]
        print(f"Hubbard U values: {hubbards}")
    else:
        print("This calculation does not use Hubbard U (likely GGA only).")
制作与mp数据库相容的计算参数
from pymatgen.core import Structure
from pymatgen.io.vasp.sets import MPStaticSet
import os


structure = Structure.from_file("POSCAR")
vasp_input_set = MPStaticSet(structure)
output_dir = "static_vasp_inputs"
os.makedirs(output_dir, exist_ok=True)
vasp_input_set.write_input(output_dir)
需要与mp数据库相符的赝势库 (tianyi /home/lizhao/software/pmg_potpat_PBE)
1. 相图-新的
1.代码
已经修正能量,注意关掉翻墙软件,需要安装新的API
新API地址:https://next-gen.materialsproject.org/api
https://matgenb.materialsvirtuallab.org/2021/05/12/Explanation-of-Corrections.html 有时候新api并不好用
新的MaterialsProject2020compatibility
https://matgenb.materialsvirtuallab.org/2021/05/12/Explanation-of-Corrections.html
from mp_api.client import MPRester
from pymatgen.core import composition
from pymatgen.io.vasp.outputs import Vasprun
from pymatgen.analysis.phase_diagram import PhaseDiagram, PDPlotter, PDEntry
from pymatgen.entries.compatibility import MaterialsProjectCompatibility
mpr=MPRester("5BhZJctjosrFpkuE6qErpu85dT4gw4VZ")
#entries = mpr.get_entries_in_chemsys(elements=["Li", "Fe", "O"])
#entries = mpr.materials.tasks.get_data_by_id("mp-2352")
mp_entries = mpr.get_entries_in_chemsys(elements=["Na","Y","Si","O"],additional_criteria={"thermo_types": ["GGA_GGA+U"]})
vasprun=Vasprun('vasprun.xml')
entry_vasp = vasprun.get_computed_entry(inc_structure=True)
compatibility = MaterialsProjectCompatibility()
entry_from_vasp = compatibility.process_entry(entry_vasp)
mp_entries.append(entry_from_vasp)
pd=PhaseDiagram(mp_entries)
stable_entries=list(pd.stable_entries)
stable_entries.append(entry_from_vasp)
pd2=PhaseDiagram(stable_entries)
#print(stable_entries)
print(stable_entries[-1])
print(pd2.get_e_above_hull(stable_entries[-1]))
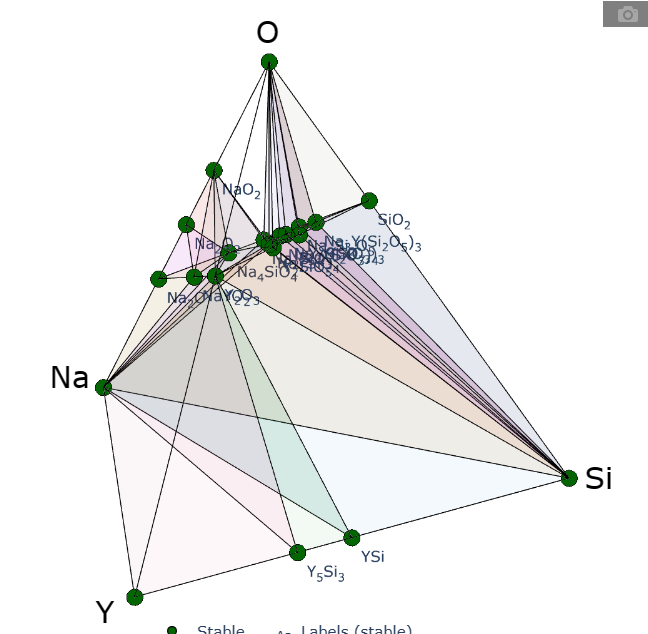
plotter = PDPlotter(pd2)
plotter.show()
plotter.write_image('pd.png', image_format='png')
###下面是拓展
#可以看出四元相图中重合的线,关掉了颜色显示
a = plotter.get_plot(fill=False)
a.show()
https://pymatgen.org/pymatgen.analysis.html#pymatgen.analysis.phase_diagram.PhaseDiagram
print(pd2.dim)
print(pd2.qhull_entries) 给出hull上所有化合物
print(pd2.qhull_data) 给出构建相图的数据,比实际相图维度少一维度,以三元A B C为例 知道A:B A:C那么B:C自然确定了,不需要增加维度
print(pd2.all_entries_hulldata) 给出hull上的所有坐标和大小
print(pd2.get_e_above_hull) 输出所有稳定的化合物
print(pd2.computed_data)
#包括facets(连接方式)
#simplexes(所有的形的坐标,三维相图里的形是二维的三角形,每个点都是坐标,坐标只有两个是因为只需要两个就能确定三角相图中一个点的位置)
#all_entries(所有的化合物)
#qhull_data(注意不能直接复制下来做相图,因为比实际多一行带2的,去掉这一行才可以。用于构建hull的数据,比实际相图维度少一维度,以三元A B C为例 知道A:B A:C那么B:C自然确定了,不需要增加) 多了一个1/3,1/3,2 多的应该是有用的,可能是用来做标定,实际上用不到,在算facets的时候没有考虑这一行。用自己下面的脚本才比较合适
#确定的方法:
1-x-y
#material project自己画的图是顺时针坐标,给出了x和z,y没给出,需要1-x-z,但是origin是逆时针画图,需要双击画出来的图,点三元图,改成顺时针,然后双击图,调出图层属性界面,在显示部分,勾选输在坐标轴前面
#dim(维度)
#el_refs(hull的顶点)
#qhull_entries(用于构建hull/hull上的化合物)
#
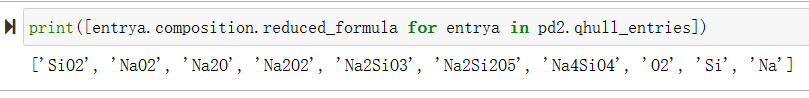
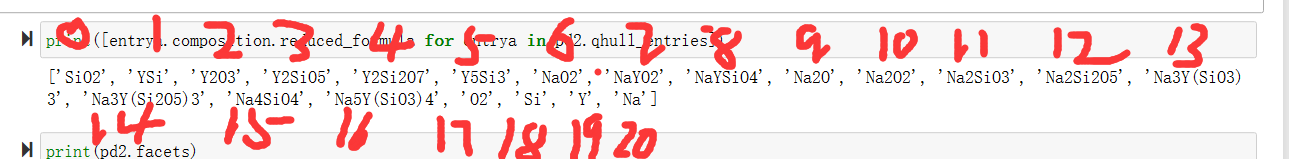
print([entrya.composition.reduced_formula for entrya in pd2.qhull_entries])
输出用于构建相图的简化的化学式
#输出带某个化合物的组合,用于构建化合物相图
import numpy as np
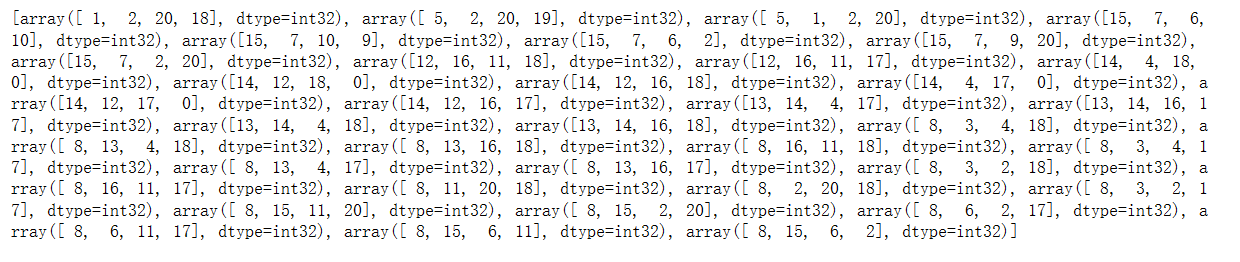
print(pd2.facets) 输出所有连接方式 每个数字与qhull.entries中的对应位置对应
matrix2 = np.vstack(pd2.facets)
rows_with_12 = matrix2[(matrix2 == 12).any(axis=1)]
#绘制化合物相图
from pymatgen.analysis.phase_diagram import PhaseDiagram, PDPlotter, PDEntry,CompoundPhaseDiagram
from pymatgen.core import Composition
SiO2 = Composition("SiO2")
Y2O3 = Composition("Y2O3")
Na2O = Composition("Na2O")
pd3=CompoundPhaseDiagram(stable_entries,[SiO2,Y2O3,Na2O])
plotterb=PDPlotter(pd3)
plotterb.show()
#给出各个化合物的配比方式 注意是在stable_entries的基础上进行计算的,这样得到的都是稳定的
#自动排除了那些不在面上的化合物,相当于一个提取,得到了转换后的化合物
ppp,ddd=pd3.transform_entries(stable_entries,[SiO2,Y2O3,Na2O])
print(ppp) #可以显示出实际的配分数
#给出各个化合物的配比方式-更加直接一点
import numpy as np
#elements_fomula = sorted({els for e in ppp for els in e.composition.elements})
#elements_fomula=list(elements_fomula)
elements_fomula=pd3.elements
data_fomula = np.array([[e.composition.get_atomic_fraction(el) for el in elements_fomula] for e in ppp])
print(data_fomula)
np.savetxt('fra.dat',data_fomula, delimiter='\t', fmt='%d')
#data = np.array([e.composition.get_atomic_fraction(el) for el in elements] + [e.energy_per_atom] for e in min_entries])
print(ppp)
print([aa.composition for aa in ppp])
#在绘制伪二元相图(两边都是二元化合物)时,pd3.get_e_above_hull会不好使用,这时候用下面的程序能够输出所有高于相图的能量
for entrya in pd3.qhull_entries:
print(entrya)
2. 绘制三元/赝三元相图代码
plotter = PDPlotter(pd2)
plotter.show()
plotter.write_image('pd.png', image_format='png')
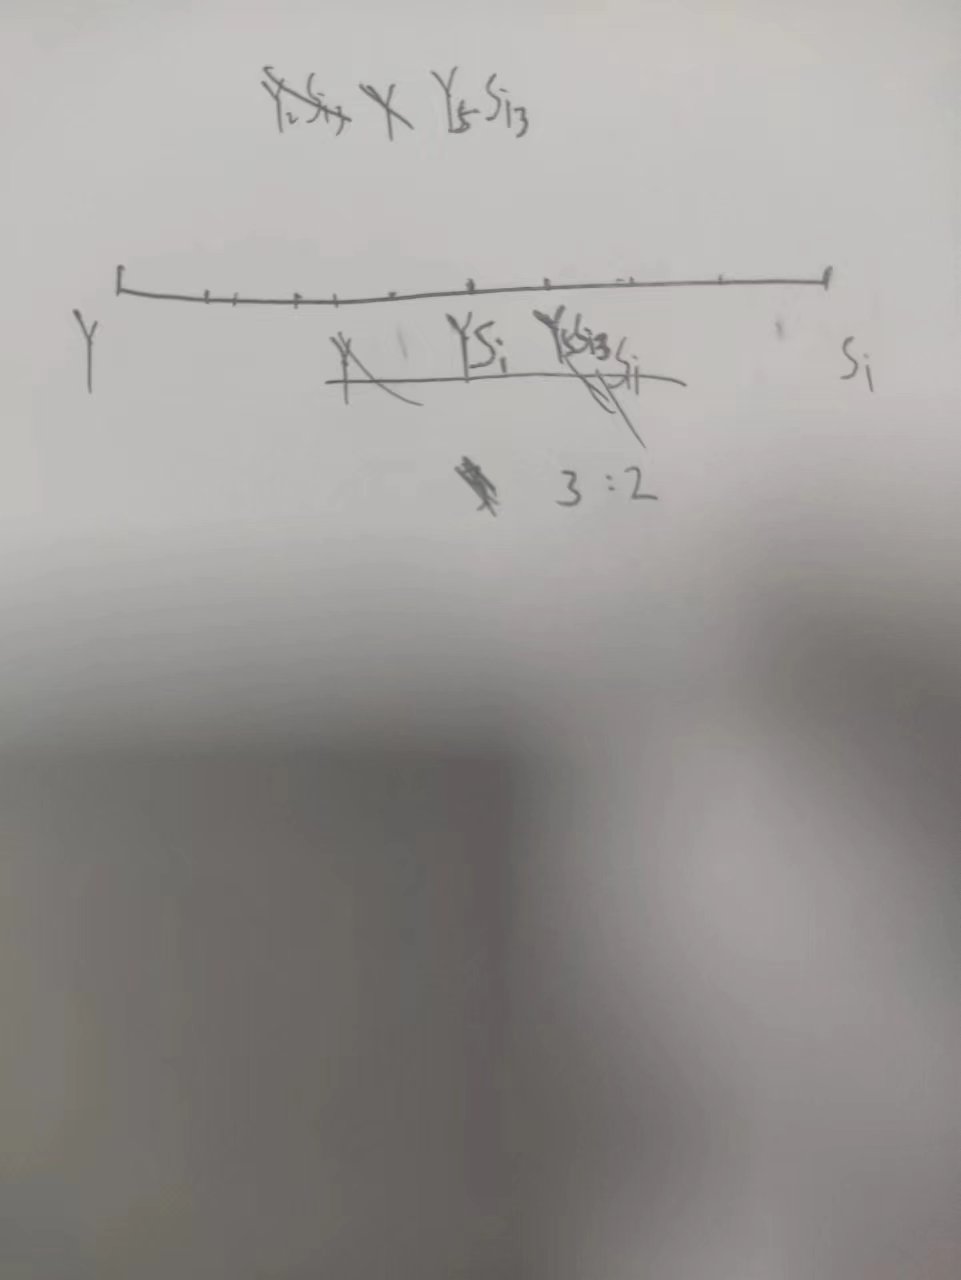
以Y-O为顶点和以Y-YSi为顶点,得到的Y5Si3的线段是不同的,赝三元相图的图像里线段不能直接比来获得比例
3. 化合物相图的输出
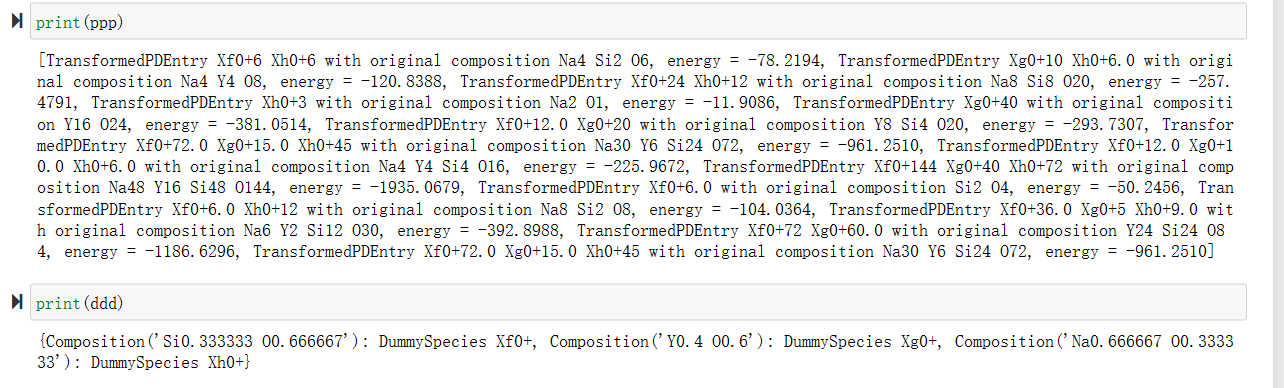
输出的化合物相图的数据,以虚拟物种的方式出现,其中,上面是每个化合物,虚拟物种xf0、xh0、xg0后面的数字代表需要的组合
4.pymatgen中的代码结构
1.化学式相图
本质上是重构entry,把化合物变成单元的
class CompoundPhaseDiagram(PhaseDiagram):
    #化学式相图的类是继承自phaseDiagram,继承的意思是子类可以使用父类的所有属性和方法
    def __init__(self, entries, terminal_compositions, normalize_terminal_compositions=True):
        self.original_entries = entries
        self.terminal_compositions = terminal_compositions
        self.normalize_terminals = normalize_terminal_compositions
        p_entries, species_mapping = self.transform_entries(entries, terminal_compositions)
        self.species_mapping = species_mapping
        super().__init__(p_entries, elements=species_mapping.values())
        #super()是用子类的这两个参数去实例化phasediagram 这两个参数分别对应虚拟化的化合物分数坐标和顶点的虚拟化物种
2. 相图
class PhaseDiagram(MSONable):
    #phasediagram继承MSONable,这个类可以用来做json的数据输入输出
    formation_energy_tol = 1e-11
    numerical_tol = 1e-8
    def __init__(
        self,
        entries: Sequence[PDEntry] | set[PDEntry],
        elements: Sequence[Element] = (),
        *,
        computed_data: dict[str, Any] | None = None,
    ) -> None:
        #computed_data接受一个字典或者none。如果提供的是一个字典,它可能包含了一些预先计算好的数据,如相图中的临界点、相边界等
        #-none表示构造函数没有返回值
        self.elements = elements
        self.entries = entries
        if computed_data is None:
            computed_data = self._compute()
            #计算得到相图的数据
def _compute(self) -> dict[str, Any]:
        if self.elements == ():
            self.elements = sorted({els for e in self.entries for els in e.elements})
            #找出所有的元素,四种、三种、两种。。。

        elements = list(self.elements)
        dim = len(elements)

        entries = sorted(self.entries, key=lambda e: e.composition.reduced_composition)

        el_refs: dict[Element, PDEntry] = {}
        min_entries: list[PDEntry] = []
        all_entries: list[PDEntry] = []
        for composition, group_iter in itertools.groupby(entries, key=lambda e: e.composition.reduced_composition):
            group = list(group_iter)
            min_entry = min(group, key=lambda e: e.energy_per_atom)
            if composition.is_element:
                el_refs[composition.elements[0]] = min_entry
            min_entries.append(min_entry)
            all_entries.extend(group)
            #对entries进行分类,找到顶点、和各个组成中能量最低的entry

        if missing := set(elements) - set(el_refs):
            raise ValueError(f"Missing terminal entries for elements {sorted(map(str, missing))}")
        if extra := set(el_refs) - set(elements):
            raise ValueError(f"There are more terminal elements than dimensions: {sorted(map(str, extra))}")

        data = np.array(
            [[e.composition.get_atomic_fraction(el) for el in elements] + [e.energy_per_atom] for e in min_entries]
        )
        #用于绘图的坐标数据
        #前三列是分数的坐标,最后一列是能量,后面dot一下就计算出来每个entry相对原点的形成能

        # Use only entries with negative formation energy
        vec = [el_refs[el].energy_per_atom for el in elements] + [-1]
        #-1直接拼接在后面,点乘后相当于直接 -E
        form_e = -np.dot(data, vec)
        idx = np.where(form_e < -PhaseDiagram.formation_energy_tol)[0].tolist()
        #得到
        # Add the elemental references
        idx.extend([min_entries.index(el) for el in el_refs.values()])
        #extend 把list2中的元素一个接一个添加到list1
        #把min_entries对应顶点位置的坐标的索引增加到idx
        qhull_entries = [min_entries[i] for i in idx]
        #所有hull上的entries
        qhull_data = data[idx][:, 1:]


        # Add an extra point to enforce full dimensionality.
        # This point will be present in all upper hull facets.
        extra_point = np.zeros(dim) + 1 / dim
        #创建一个一行三列的向量
        extra_point[-1] = np.max(qhull_data) + 1
        qhull_data = np.concatenate([qhull_data, [extra_point]], axis=0)
        #增加了一行

        if dim == 1:
            facets = [qhull_data.argmin(axis=0)]
        else:
            facets = get_facets(qhull_data)
            final_facets = []
            for facet in facets:
                # Skip facets that include the extra point
                if max(facet) == len(qhull_data) - 1:
                    continue
                    #去除增加的行的影响,不清楚为什么加一行,可能前面有用
                m = qhull_data[facet]
                m[:, -1] = 1
                if abs(np.linalg.det(m)) > 1e-14:
                    final_facets.append(facet)
            facets = final_facets

        simplexes = [Simplex(qhull_data[f, :-1]) for f in facets]
        #用于找到不同三角形的坐标
        self.elements = elements
        return {
            "facets": facets,
            "simplexes": simplexes,
            "all_entries": all_entries,
            "qhull_data": qhull_data,
            "dim": dim,
            # Dictionary with Element keys is not JSON-serializable
            "el_refs": list(el_refs.items()),
            "qhull_entries": qhull_entries,
        }
computed_data

2. 老的,似乎不能用了 (不能从materials project数据库中提取数据了)
from pymatgen.io.vasp.outputs import Vasprun
import pandas as pd
from pymatgen.ext.matproj import MPRester
from pymatgen.analysis.phase_diagram import PhaseDiagram, PDPlotter, PDEntry
from pymatgen.entries.compatibility import MaterialsProjectCompatibility

vasprun=Vasprun('vasprun.xml')
entry = vasprun.get_computed_entry(inc_structure=True)
compatibility = MaterialsProjectCompatibility()
entry = compatibility.process_entry(entry)
a=MPRester('BhgyCJsKOOA3cRIi')
mp_entries=a.get_entries_in_chemsys(['K','Y','Si','O'])
mp_entries.append(entry)
phd=PhaseDiagram(mp_entries)
stable_entries=list(phd.stable_entries)
stable_entries.append(entry)
phd2=PhaseDiagram(stable_entries)
#print(stable_entries)
print(stable_entries[-1])
print(phd2.get_e_above_hull(stable_entries[-1]))
plotter = PDPlotter(phd2)
plotter.show()
3. 从现有数据的.dat文件读取然后绘制相图
(/work/home/liz/workspace/1-system-MD/2-Li5YSi4O12/6phase/LYSO)
一个lyso.dat
H2 , -25.63388726
Ca8H32 , -8476.873008
Ca8H46 , -8661.706131
Ca8H48 , -8686.909539
#注意下面不能有空行
from pymatgen.analysis.phase_diagram import *
from pymatgen.core.periodic_table import Element, DummySpecie
from pymatgen.core.composition import Composition
entries = []
with open('lyso.dat') as fr :
    for line in fr :
      comp, ene = line.split(',')
      entries.append(PDEntry(Composition(comp), float(ene)))
pd = PhaseDiagram(entries)
#stable_formulas = [ent.name for ent in pd.stable_entries]
entry=PDEntry(composition='Li30Y6Si24O72',energy=-937.044768)
stable_entries=list(pd.stable_entries)
#print(pd.stable_entries)
stable_entries.append(entry)
phd=PhaseDiagram(stable_entries)
#plotter=PDPlotter(phd,show_unstable=True)
#plotter.show()
print(stable_entries[-1])
print(phd.get_e_above_hull(stable_entries[-1]))
#for formula in stable_formulas:
#        print (formula)
#for e in entries:
#        ehull = pd.get_e_above_hull(e)
#        print (e.composition, ehull)
#plotter = PDPlotter(pd)
#plotter.show()
#plotter.write_image('pd.png', image_format='png')
#entries.append(PDEntry(Composition('Li2MgH15'),float(3.1)))
#pd.get_e_above_hull(entries[9])
#pd.get_all_chempots(Composition('MgH16')) 一个化合物中所有元素的化学势
#pd.get_chempot_range_map([Element('Li')])  每个化合物某种元素的化学势范围
#get_composition_chempots(comp)
print(phd.get_decomp_and_e_above_hull(stable_entries[-1]))
4. 巨势相图
from pymatgen.io.vasp.outputs import Vasprun
import pandas as pd
from pymatgen.ext.matproj import MPRester
from pymatgen.analysis.phase_diagram import PhaseDiagram, PDPlotter, PDEntry
from pymatgen.entries.compatibility import MaterialsProjectCompatibility
from pymatgen.analysis.phase_diagram import *
from pymatgen.core.periodic_table import Element, DummySpecie
from pymatgen.core.composition import Composition
vasprun=Vasprun('vasprun.xml')
entry = vasprun.get_computed_entry(inc_structure=True)
compatibility = MaterialsProjectCompatibility()
entry = compatibility.process_entry(entry)
a=MPRester('BhgyCJsKOOA3cRIi')
mp_entries=a.get_entries_in_chemsys(['Na','Y','Si','O'])
mp_entries.append(entry)
phd=PhaseDiagram(mp_entries)
li_entries = [e for e in mp_entries if e.composition.reduced_formula == "Li"]
uli0 = min(li_entries, key=lambda e: e.energy_per_atom).energy_per_atom
el_profile = phd.get_element_profile(Element("Li"), mp_entries[-1].composition)
for i, d in enumerate(el_profile):
    voltage = -(d["chempot"] - uli0)
    print("Voltage: %s V" % voltage)
    print(d["reaction"])
    print("")
新的
from mp_api.client import MPRester
from pymatgen.core import composition
from pymatgen.io.vasp.outputs import Vasprun
from pymatgen.analysis.phase_diagram import PhaseDiagram, PDPlotter, PDEntry
from pymatgen.entries.compatibility import MaterialsProjectCompatibility
from pymatgen.core.periodic_table import Element, DummySpecie

mpr=MPRester("5BhZJctjosrFpkuE6qErpu85dT4gw4VZ")
mp_entries = mpr.get_entries_in_chemsys(elements=["Na","Y","Si","O"],additional_criteria={"thermo_types": ["GGA_GGA+U"]})
vasprun=Vasprun('Na.xml')
entry_vasp = vasprun.get_computed_entry(inc_structure=True)
compatibility = MaterialsProjectCompatibility()
entry_from_vasp = compatibility.process_entry(entry_vasp)
mp_entries.append(entry_from_vasp)
phd=PhaseDiagram(mp_entries)
na_entries = [e for e in mp_entries if e.composition.reduced_formula == "Na"]
una0 = min(na_entries, key=lambda e: e.energy_per_atom).energy_per_atom
print(mp_entries[-1])
el_profile = phd.get_element_profile(Element("Na"), mp_entries[-1].composition)
for i, d in enumerate(el_profile):
    voltage = -(d["chempot"] - una0)
    print("Voltage: %s V" % voltage)
    print(d["reaction"])
    print("")
2. 相图解释 (三元三角、四元四面体)
1.相图的理解
E_above_hull并不是垂直线的高度,而是分解为hull上的三个化合物的分解能,经过了验证
x y z z
四面体只需要四个顶点
三维相图
==逆时针==
#print([entrya.composition.reduced_formula for entrya in pd2.qhull_entries])
#print(pd2.facets) 输出所有连接方式 (标号是上面的顺序,从0开始 ) pymatgen

四元
目的是把块分成区域,每个区域不再能分配
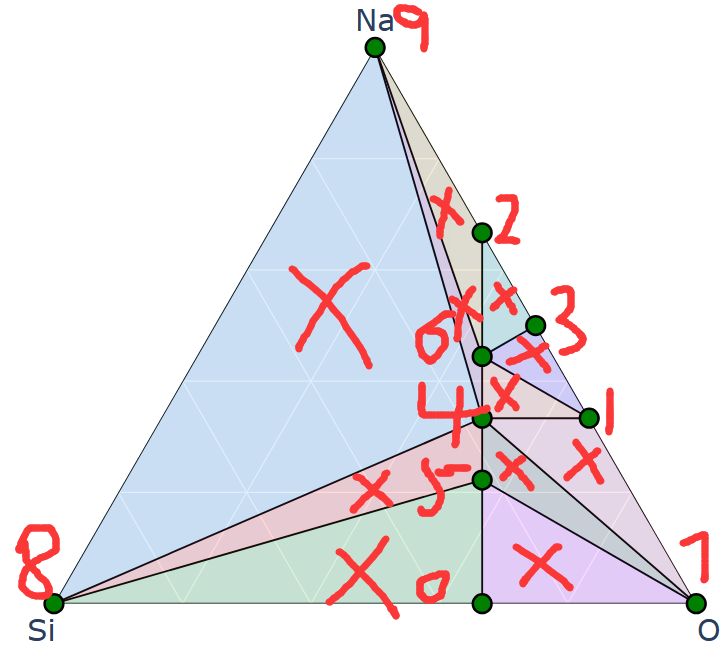
三元相图是由一系列的小三元相图构图的,而小三元相图是由二元相图的边构成的。同理,四元相图由小四元四面体组成,而小四元四面体的边是二元相图,一个面是一个三元相图。
==三元比二元多出来的特征在于可以有一些只能分解为三元的化合物,其他的稳定化合物完全可以以化合物为顶点做一个二元相图。而四元多出来的特征在于可以有一些只能分解为四个组分的化合物(在四面体中间),要表示四元相图中的稳定结构,完全可以用三元相图、或者二元相图表示。==

1.关于分解
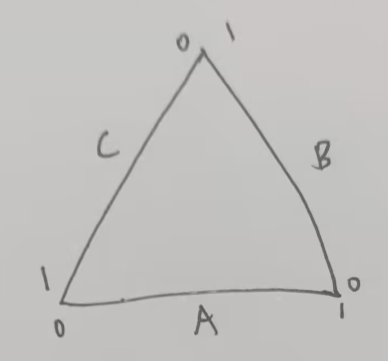
==二元相图的横坐标是 y/(x+y) ,y占据的百分数,二元的点本质上纵坐标都可以设置为在线上,只不过是能量的差别设置出来了高度,落在哪条线上就会分解为线的两端,三元落在哪个三角里就会分解为哪三个化合物,四元落在哪个四面体内就会分解为哪四个化合物==
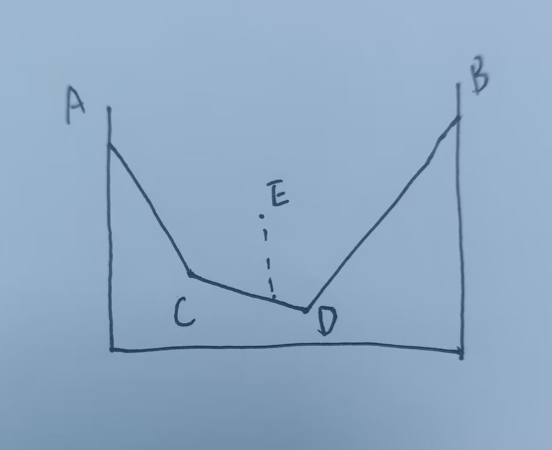
E总是可以分解为C和D,当然也可以分解为A和D,但是一部分A和D可以生成更低的C,说明
E—A+D 并不完全,后面还有 A+D—–C+D,因此最终必然分解为C+D
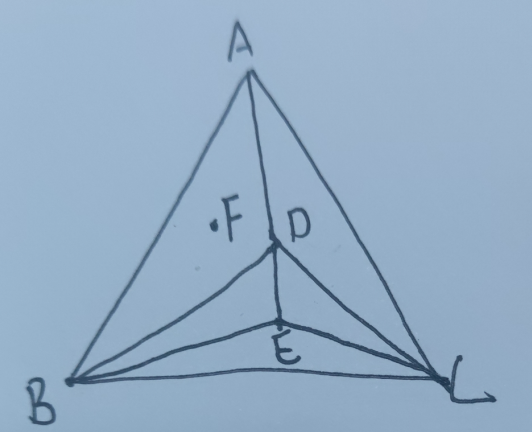
对于三元,F总能分解为A+B+D ,也可分解为A+B+C,但是A+B+C会合成D(因为D总是由A、B、C组成,道理和下面的解释一样),最终还是直接分解为D的能量最稳定。
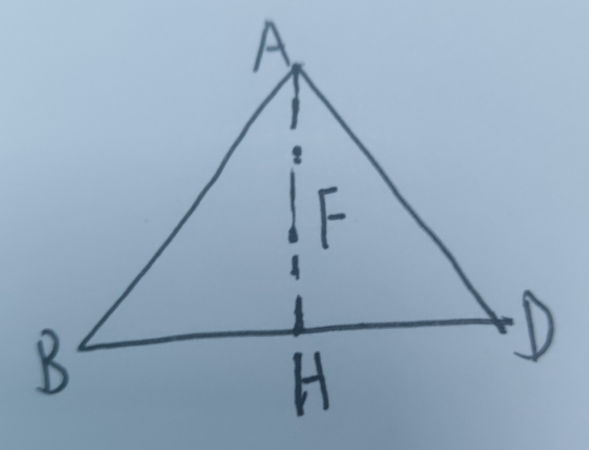
为什么F总能分解为A+B+D? : 因为F总能由A和H组成,而H总能由B+D组成,最终,F总能由A+B+D组成。
四元同理,四元的四面体内的不稳定化合物总可以先分解为三角形,再分解为线,再分解为点。
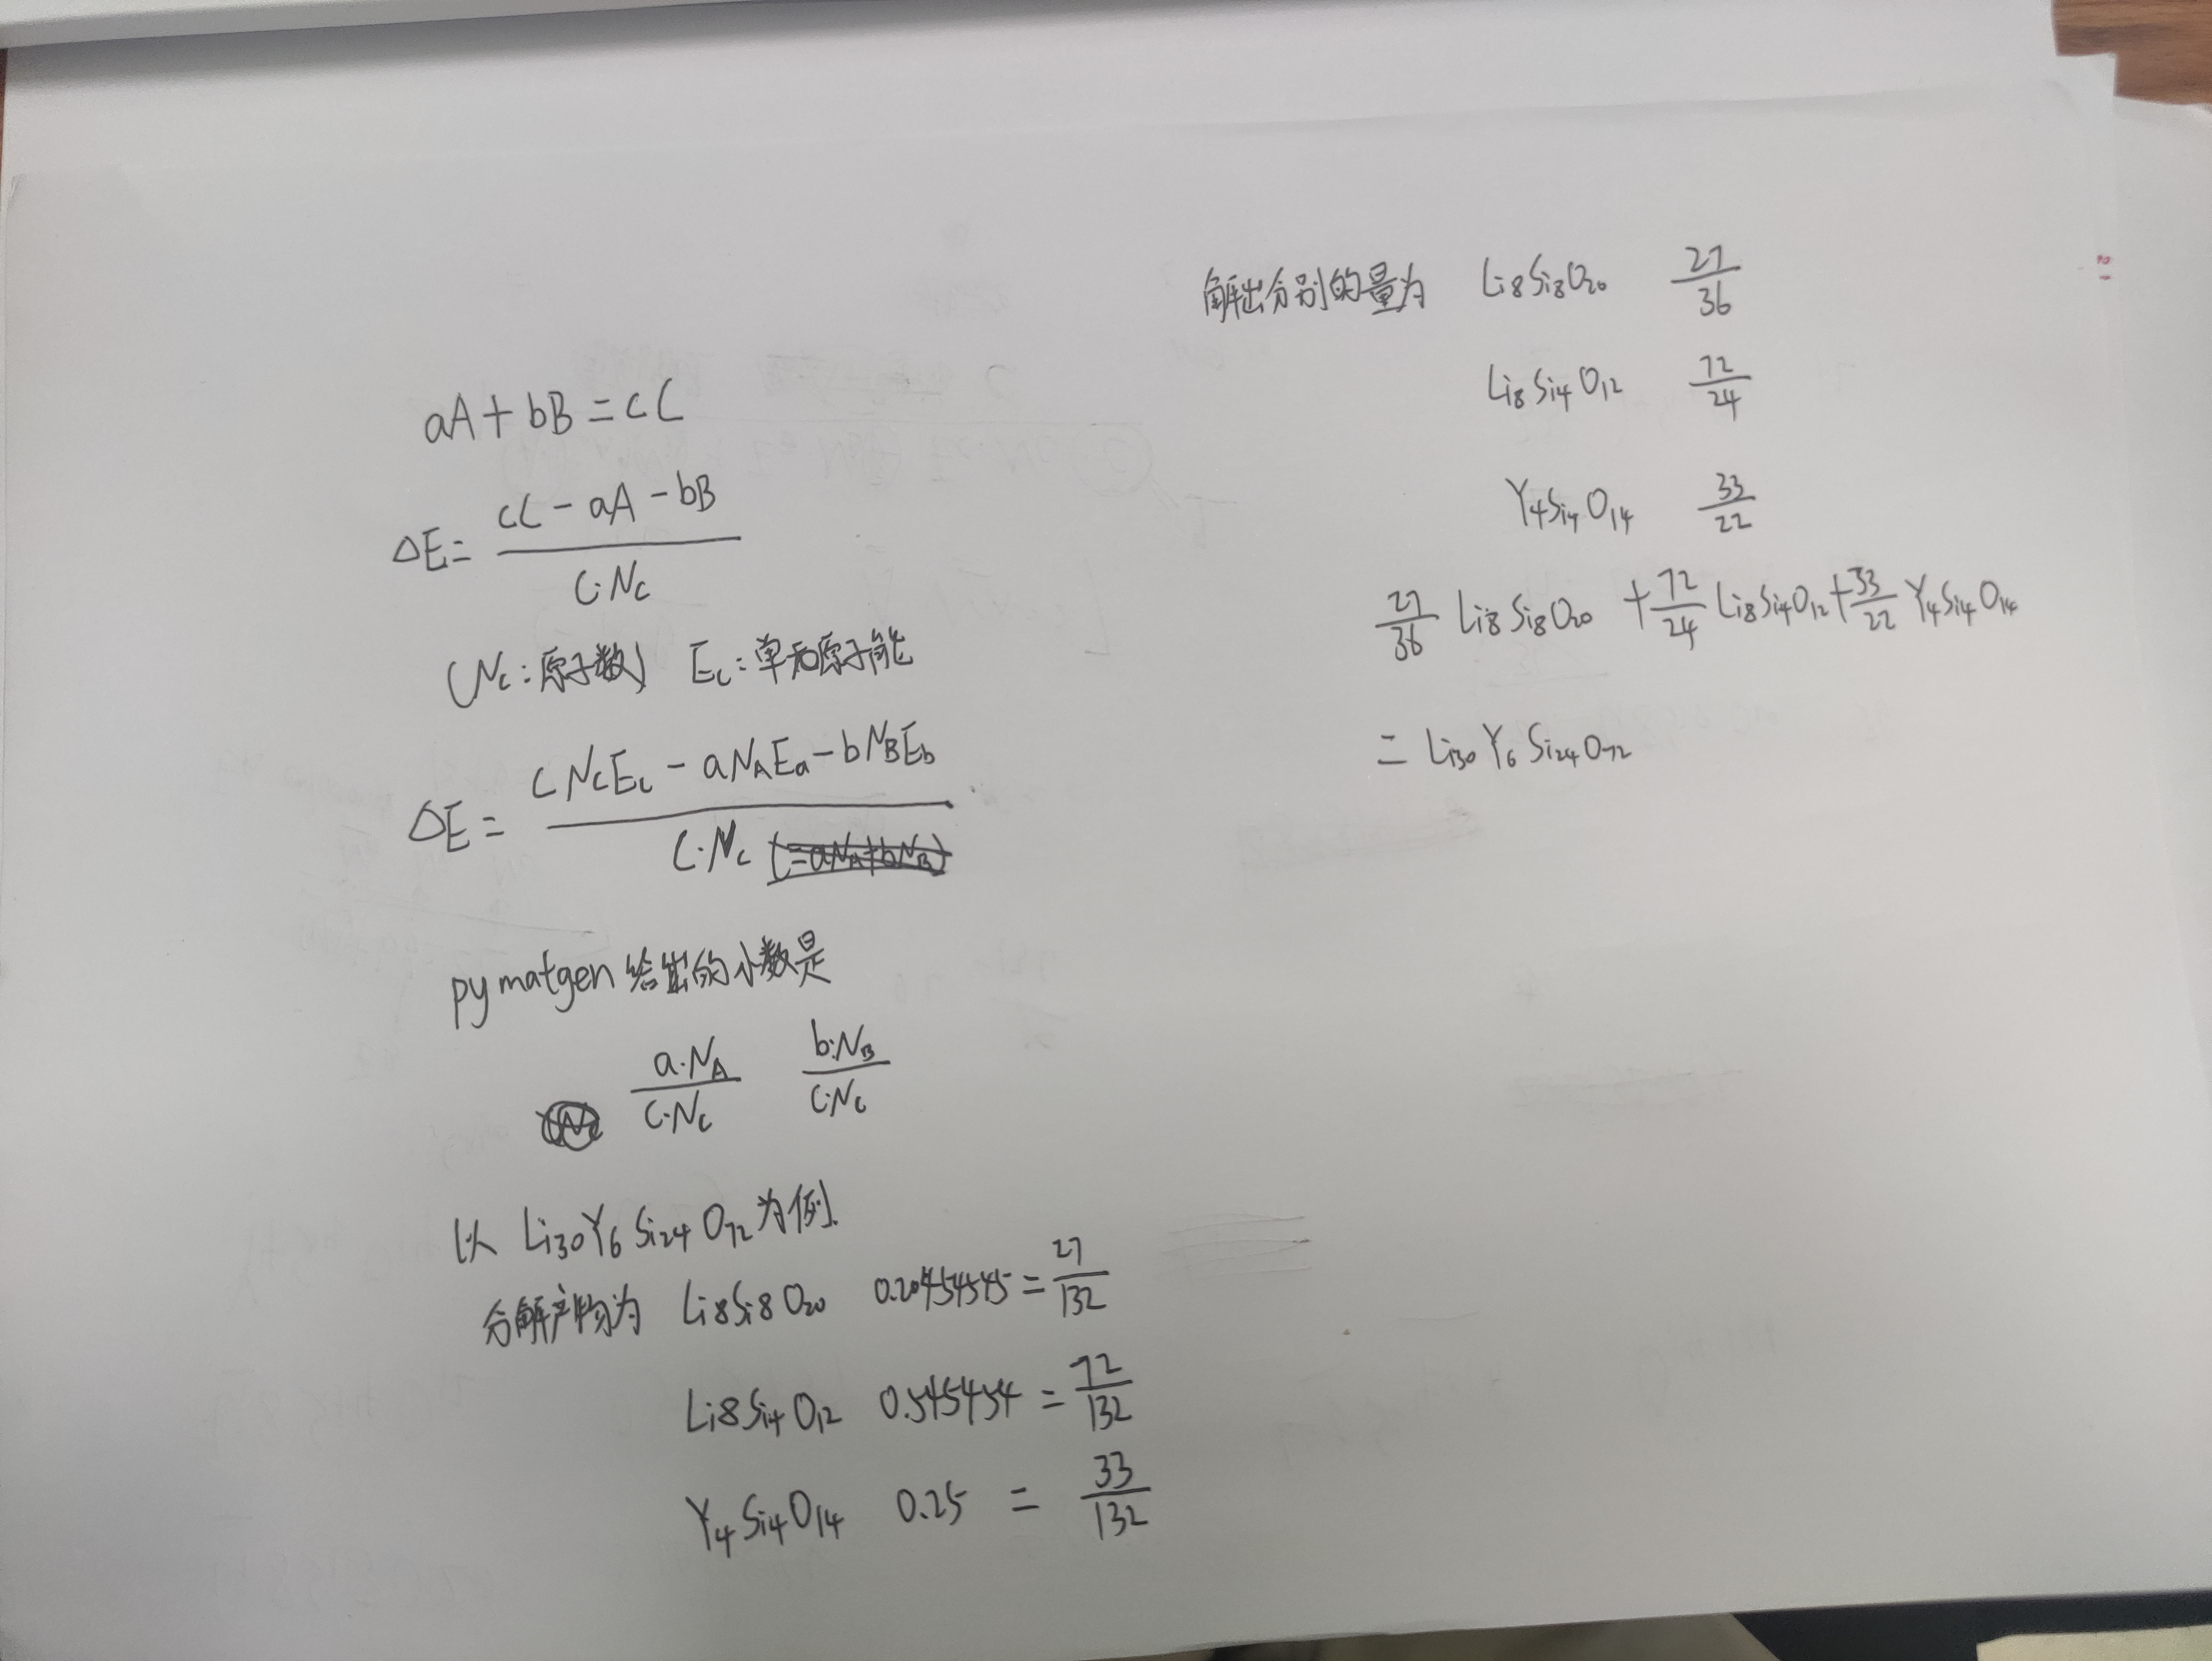
3. 计算化合物的分解
print(phd.get_decomp_and_e_above_hull(stable_entries[-1]))
可以给出分解的路径,进而求出结合能(和e_above_hull是不一样的)

也可以给出结合能,用里面的函数
路径 /work/home/liz/workspace/1-system-MD/2-Li5YSi4O12/6phase/LYSO

4.绘制相图(三元三角、四元四面体)
https://www.originlab.com/doc/en/Origin-Help/3d-Tetrahedral
x y z z
四面体只需要四个顶点
三维相图
#print([entrya.composition.reduced_formula for entrya in pd2.qhull_entries])
#print(pd2.facets) 输出所有连接方式 (标号是上面的顺序,从0开始 ) pymatgen
四元
目的是把块分成区域,每个区域不再能分配
三元相图是由一系列的小三元相图构图的,而小三元相图是由二元相图的边构成的。同理,四元相图由小四元四面体组成,而小四元四面体的边是二元相图,一个面是一个三元相图。
==三元比二元多出来的特征在于可以有一些只能分解为三元的化合物,其他的稳定化合物完全可以以化合物为顶点做一个二元相图。而四元多出来的特征在于可以有一些只能分解为四个组分的化合物(在四面体中间),要表示四元相图中的稳定结构,完全可以用三元相图、或者二元相图表示。==
5. 计算可能的合成路径
from pymatgen.core import Composition
from sympy import symbols, Eq, solve
from itertools import combinations
from mp_api.client import MPRester
from pymatgen.io.vasp.outputs import Vasprun
from pymatgen.analysis.phase_diagram import PhaseDiagram, PDPlotter, PDEntry,CompoundPhaseDiagram
from pymatgen.entries.compatibility import MaterialsProjectCompatibility


def solvechemical(entries,target_entry):
    reduced_a = entries[0].composition.reduced_formula
    reduced_b = entries[1].composition.reduced_formula
    reduced_c = entries[2].composition.reduced_formula
#     print(reduced_a,reduced_b,reduced_c)
    reduced_aa = entries[0].composition
    reduced_bb = entries[1].composition
    reduced_cc = entries[2].composition
    reduced_target = target_entry.composition
    compounda, factora = reduced_aa.get_reduced_composition_and_factor()
    compoundb, factorb = reduced_bb.get_reduced_composition_and_factor()
    compoundc, factorc = reduced_cc.get_reduced_composition_and_factor()
    reduced_compositiontarget, factortarget = reduced_target.get_reduced_composition_and_factor()
    compound_a = Composition(reduced_a)
    compound_b = Composition(reduced_b)
    compound_c = Composition(reduced_c)
    target_compound = Composition(target_entry.composition.reduced_formula)
    x, y, z = symbols('x y z')

    # 获取目标化合物所含元素
    elements = target_compound.as_dict().keys()

    #不能是通解的判断
    # 为每个元素设置质量守恒方程
    equations = []

    for element in elements:
        # 每个化合物中该元素的数量
        eq = (
            x * compound_a.get(element, 0) +
            y * compound_b.get(element, 0) +
            z * compound_c.get(element, 0) -
            target_compound.get(element, 0)
        )
        equations.append(Eq(eq, 0))
    solution = solve(equations, (x, y, z), dict = True)
    # 判断并输出结果
    if solution:
        valid_solutions = []
        for sol in solution:
        # 检查解是否包含自由变量(通解)
            has_free_symbols = any(val.free_symbols for val in sol.values())
        # 检查解是否全部非负且为具体数值
            if not has_free_symbols:
                is_valid = all(val.evalf() >= 0 and val.is_number for val in sol.values())
                if is_valid:
                    valid_solutions.append(sol)

        if valid_solutions:
            coeffs = solution[0]
            formation_energy = (target_entry.energy / factortarget - (coeffs[x] / factora * entries[0].energy + coeffs[y] / factorb * entries[1].energy + coeffs[z] / factorc * entries[2].energy))
            results.append((f"{reduced_a}, {reduced_b}, {reduced_c}", [value for value in solution[0].values()], formation_energy))
            # print(reduced_a,reduced_b,reduced_c,end = ',')
            # print(entries[0].energy/factora,entries[1].energy/factorb,entries[2].energy/factorc, target_entry.energy / factortarget,  end = ',')
            # print(f"可以生成目标化合物,配平系数为: {solution}")
            # print(print([value for item in solution for value in item.values()]),end = ',')
            #print(([value for value in solution[0].values()]),end = ',')
            #entries = list(entries)
            #entries.append(target_entry)
            print(f"目标化合物 {target_entry.composition.reduced_formula} 的形成能为: {formation_energy:.3f} eV")
            #print(f"{formation_energy:.3f} eV")

    #    else:
    #        print("无法通过这三个化合物生成目标化合物。")


mpr=MPRester("5BhZJctjosrFpkuE6qErpu85dT4gw4VZ")
mp_entries = mpr.get_entries_in_chemsys(elements=["K","Y","Si","O"],additional_criteria={"thermo_types": ["GGA_GGA+U"]})


vasprun=Vasprun('vasprun.xml')
vasprun2 = Vasprun('oqmd.xml')
entry_vasp = vasprun.get_computed_entry(inc_structure=True)
entry_vasp2 = vasprun2.get_computed_entry(inc_structure=True)
compatibility = MaterialsProjectCompatibility()
entry_from_vasp = compatibility.process_entry(entry_vasp)
entry_from_vasp2 = compatibility.process_entry(entry_vasp2)
mp_entries.append(entry_from_vasp)
mp_entries.append(entry_from_vasp2)
pd=PhaseDiagram(mp_entries)
stable_entries=list(pd.stable_entries)
print(len(stable_entries))
entry_vasp_formula = entry_vasp.composition.reduced_formula
stable_entries = [entry for entry in stable_entries if entry.composition.reduced_formula != entry_vasp_formula]
print(len(stable_entries))

results = []
for entry_combo in combinations(stable_entries,3):
    solvechemical(entry_combo,entry_from_vasp)
results.sort(key=lambda x: x[2])

for combo, coeffs, energy in results:
    print(f"{combo}, {coeffs}, {energy:.3f} eV")
转换输出为latex格式
import re

def read_and_convert(file_path):
    with open(file_path, 'r', encoding='utf-16') as file:
        lines = file.readlines()

    latex_output = []

    for line in lines:
        # 去除空格和换行符
        line = line.strip()
        # 使用正则表达式匹配和提取数据
        match = re.match(r'([\w\d, ]+), \[([\d., ]+)\], (-?\d+\.\d+) eV', line)
        if match:
            compounds = match.group(1).split(', ')
            coefficients = list(map(float, match.group(2).split(', ')))
            energy = match.group(3)

            # 构建LaTeX化学方程式
            latex_equation = '\\ce{'
            for i, compound in enumerate(compounds):
                coefficient = coefficients[i]
                if coefficient != 1.0:
                    latex_equation += f'{coefficient:.3g} '
                latex_equation += compound + ' + '
            latex_equation = latex_equation.rstrip(' + ') + '} & ' + energy + ' eV' + ' \\\\'

            latex_output.append(latex_equation)

    return latex_output

# 读取文件并转换
file_path = 'solve2.dat'
latex_equations = read_and_convert(file_path)

# 打印转换后的LaTeX化学方程式
for equation in latex_equations:
    print(equation)
6. help Pr. congwei
- 画普通相图
#usage: python pd.py PD.txt
import pandas as pd
from pymatgen.core import Composition
from pymatgen.analysis.phase_diagram import PDEntry, PhaseDiagram, PDPlotter
import argparse


if __name__ == "__main__":
    parser = argparse.ArgumentParser(description="Process phase diagram from input file.")
    parser.add_argument('filename', type=str, help='Path to the input file')
    args = parser.parse_args()
    filename = args.filename

colspecs = [
    (0, 25),    # Name
    (25, 42),   # Composition
    (42, 46),   # Sym
    (46, 61),   # Enthalpy
    (61, 80),   # Volume
    (80, 97),  # Density
    (99, 116), # FormEnthalpy
    (116, None) # Instability (到最后)
]

all_data = pd.read_fwf(filename, colspecs=colspecs,header=0)

compositions = all_data['Composition']
enthalpy = all_data['Enthalpy']

entries = []
for i in range(len(compositions)):
    comp = Composition(compositions[i])
    total_atoms = comp.num_atoms
    total_energy = total_atoms * enthalpy[i]
    entry = PDEntry(comp,total_energy)
    entries.append(entry)

phase_diagram = PhaseDiagram(entries)
plotter = PDPlotter(phase_diagram,show_unstable = 1)
plotter.show()
#plotter.write_image('pd.png', image_format='png')
画化合物相图
#usage: python pd.py PD.txt
import pandas as pd
from pymatgen.core import Composition
from pymatgen.analysis.phase_diagram import PDEntry, PhaseDiagram, PDPlotter,CompoundPhaseDiagram
import argparse


if __name__ == "__main__":
    parser = argparse.ArgumentParser(description="Process phase diagram from input file.")
    parser.add_argument('filename', type=str, help='Path to the input file')
    args = parser.parse_args()
    filename = args.filename

colspecs = [
    (0, 25),    # Name
    (25, 42),   # Composition
    (42, 46),   # Sym
    (46, 61),   # Enthalpy
    (61, 80),   # Volume
    (80, 97),  # Density
    (99, 116), # FormEnthalpy
    (116, None) # Instability (到最后)
]

all_data = pd.read_fwf(filename, colspecs=colspecs,header=0)

compositions = all_data['Composition']
enthalpy = all_data['Enthalpy']

entries = []
for i in range(len(compositions)):
    comp = Composition(compositions[i])
    total_atoms = comp.num_atoms
    total_energy = total_atoms * enthalpy[i]
    entry = PDEntry(comp,total_energy)
    entries.append(entry)

phase_diagram = PhaseDiagram(entries)
plotter = PDPlotter(phase_diagram,show_unstable = 1)
#plotter.show()
plotter.write_image('pd.png', image_format='png')

aa = Composition("Li2O")
bb = Composition("B2O3")
cc = Composition("LiF")
pd2=CompoundPhaseDiagram(entries,[aa,bb,cc])
plotterb=PDPlotter(pd2)
plotterb.write_image('pd2.png', image_format='png')
#plotterb.show()
print(pd2.qhull_data)
#plotter.write_image('pd.png', image_format='png')
转载请注明来源 有问题可通过github提交issue