6. 计算RDF(径向分布函数)
1. 理论知识
1.https://bohrium.dp.tech/notebooks/7293
2.知乎 径向分布函数Radial distribution function - 知乎 (zhihu.com)
1.2: Radial Distribution Function - Chemistry LibreTexts
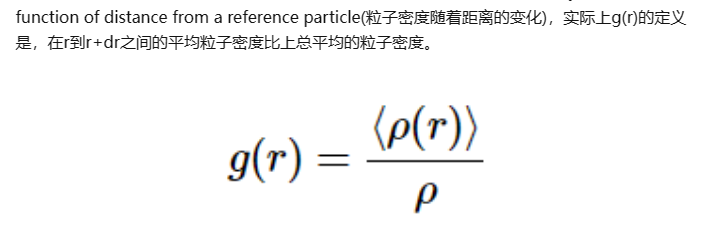

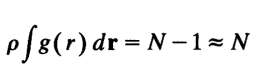
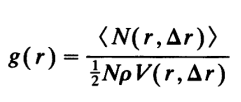
这里的平均粒子数密度既包括了时间平均,也包括了对不同位置处的平均
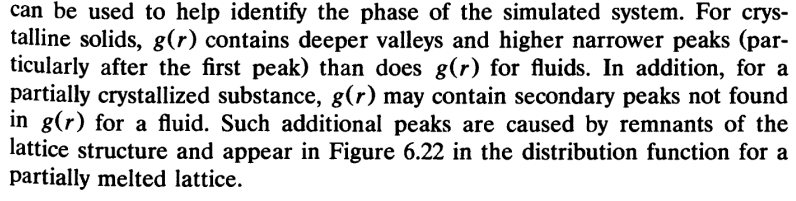
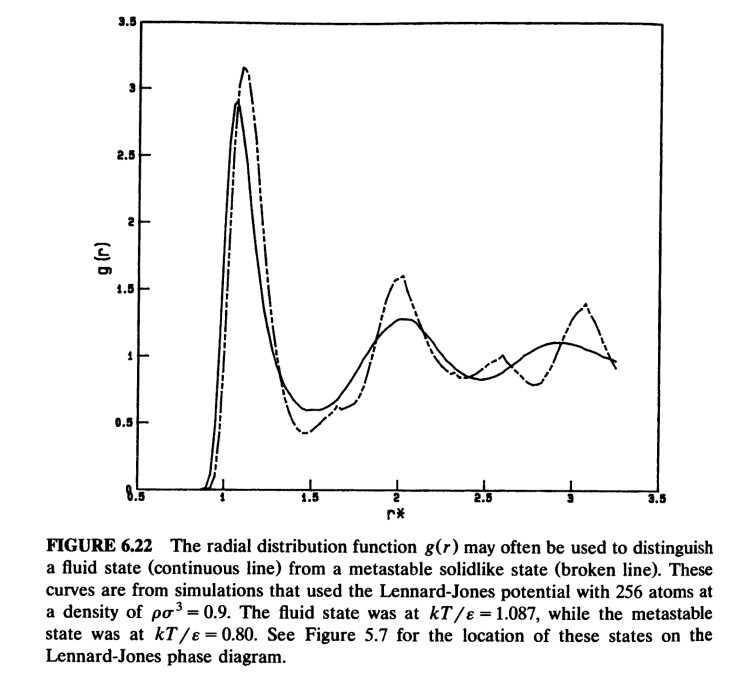
3. 课本复杂版本 J.M.HAILE molecular dynamics simulation ==page 260==
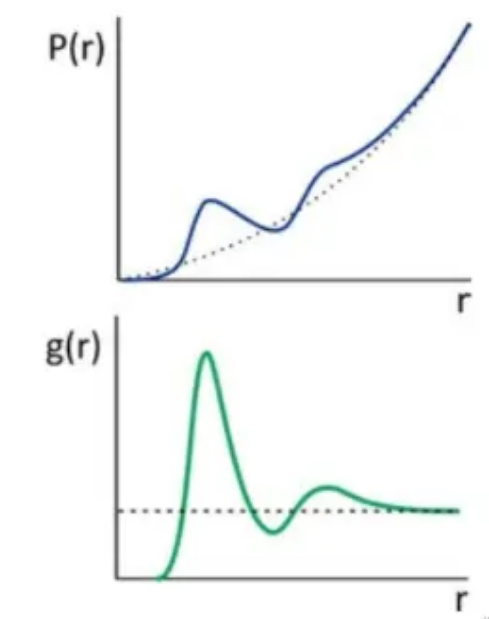
g(r)正比于发现原子对为r的两个原子的概率

1. OVITO
2. 脚本
1. fortran
!November 10, 2015  by Peihao Huang --<<Computer simulation of liquids>> page 183
program main
implicit none
integer                  ::k,i,j,Natoms,step,Nstep,n,n1,n2,BIN,MAXBIN,reject,Nreject
real(kind=8)             ::factor,a(3,3),r1,r2,r3,Rx,Ry,Rz,Rsq,R,DELR,RMAX,CONST,RHO,RLOWER,RUPPER,NIDEAL,RMIDDLE,Volume,Total,Coor,Rmin
real(kind=8),allocatable ::x(:),y(:),z(:),GR(:)
integer,allocatable      ::HIST(:)
real,parameter           ::PI=3.14159265
!These parameters should be input by hand
DELR=0.1       !间距?不用改
RMAX=5.9       !最小晶格常数的一半
Nreject=6000  !去掉的步数
Nstep=10477    !剩下的步数
!Initialize
MAXBIN=INT(ANINT(RMAX/DELR))
allocate(HIST(MAXBIN))
allocate(GR(MAXBIN))
do k=1,MAXBIN
  HIST(k)=0
end do
!Read the structural information
open(unit=10,file='XDATCAR_300GPa_2300K')
read(10,*)
read(10,*)factor
read(10,*)a(1,1),a(1,2),a(1,3)
read(10,*)a(2,1),a(2,2),a(2,3)
read(10,*)a(3,1),a(3,2),a(3,3)
do i=1,3
  do j=1,3
    a(i,j)=a(i,j)*factor
  end do
end do
read(10,*)
read(10,*)Natoms
allocate(x(Natoms))
allocate(y(Natoms))
allocate(z(Natoms))
!Calculate the average density of the system
Volume=a(1,2)*a(2,3)*a(3,1)+a(1,3)*a(2,1)*a(3,2)+a(1,1)*a(2,2)*a(3,3)-a(1,3)*a(2,2)*a(3,1)-a(1,1)*a(2,3)*a(3,2)-a(1,2)*a(2,1)*a(3,3)
RHO=REAL(Natoms)/Volume
write(*,*)"The total Volume is ",Volume
!Reject some steps before equilibrium
do reject=1,Nreject
  read(10,*)
  do n=1,Natoms
    read(10,*)
  end do
end do
!Read the equilibrium steps
do step=1,Nstep
  read(10,*)
  do n=1,Natoms
    read(10,*)x(n),y(n),z(n)
  end do
  do n1=1,Natoms-1
    do n2=n1+1,Natoms
      !Calculate minimum image distances
      r1=x(n2)-x(n1)
      r1=r1-ANINT(r1)
      r2=y(n2)-y(n1)
      r2=r2-ANINT(r2)
      r3=z(n2)-z(n1)
      r3=r3-ANINT(r3)
      !Fractional to cartesian
      Rx=r1*a(1,1)+r2*a(2,1)+r3*a(3,1)
      Ry=r1*a(1,2)+r2*a(2,2)+r3*a(3,2)
      Rz=r1*a(1,3)+r2*a(2,3)+r3*a(3,3)
      Rsq=Rx**2+Ry**2+Rz**2
      R=SQRT(Rsq)
      !Sort the distances between the N atoms into histogram
      BIN=INT(R/DELR)+1
      if(BIN<=MAXBIN) then
        HIST(BIN)=HIST(BIN)+2
      end if
    end do
  end do
end do
!Normalize
CONST=4.0*PI*RHO/3
do BIN=1,MAXBIN
  RLOWER=REAL(BIN-1)*DELR
  RUPPER=RLOWER+DELR
  NIDEAL=CONST*(RUPPER**3-RLOWER**3)
  GR(BIN)=REAL(HIST(BIN))/REAL(Nstep)/REAL(Natoms)/NIDEAL
end do
close(10)
!Write
open(unit=20,file='rdf.dat')
do BIN=1,MAXBIN
  RMIDDLE=REAL(BIN-1)*DELR+DELR/2
  write(20,*)RMIDDLE,GR(BIN)
end do
close(20)
!Check (RMAX should be set to sqrt(3)/2*L for cubic box)
Total=0
do BIN=1,MAXBIN
  RLOWER=REAL(BIN-1)*DELR
  RUPPER=RLOWER+DELR
  NIDEAL=CONST*(RUPPER**3-RLOWER**3)
  Total=Total+GR(BIN)*NIDEAL
!  Total=Total+RHO*4*PI*(DELR*BIN)**2*GR(BIN)*DELR #this one is less accurate
end do
write(*,*)"The total number of atoms is ",Total

!Calculate coordination number (method1: input by hand)
Coor=0
do BIN=1,44
  RLOWER=REAL(BIN-1)*DELR
  RUPPER=RLOWER+DELR
  NIDEAL=CONST*(RUPPER**3-RLOWER**3)
  Coor=Coor+GR(BIN)*NIDEAL
  Rmin=REAL(BIN-1)*DELR+DELR/2
end do
write(*,*)"The coordination number is ",Coor,",and rmin is ",Rmin

!(method 2)
Coor=0
do BIN=1,MAXBIN
  RLOWER=REAL(BIN-1)*DELR
  RUPPER=RLOWER+DELR
  NIDEAL=CONST*(RUPPER**3-RLOWER**3)
  Coor=Coor+GR(BIN)*NIDEAL
  Rmin=REAL(BIN-1)*DELR+DELR/2
  if((BIN>1).and.(BIN<MAXBIN).and.(GR(BIN)<GR(BIN-1)).and.(GR(BIN)<GR(BIN+1))) then
    write(*,*)"The coordination number is ",Coor,",and rmin is ",Rmin
    exit
  end if
end do


deallocate(x)
deallocate(y)
deallocate(z)
deallocate(HIST)
deallocate(GR)
end program main
2. python (ovito )
conda下载ovito用官方的软件源(官方网址中有)不用conda-forge (官方python有付费版功能,conda源版没有)
##write by lijiaxiang

# example script for calculating and plotting RDFs and partial RDFs
# CAN NOT BE USED DIRECTLY!
#       modify and run this script.
#       add plt.savefig('fig') if you want to save the RDF figures.
# # # # # # # # # # # # # # # # # # # # # # # # # # # # # # # # # # # # # # # # # # # # # # # # # # # # # # # # # # # #


from ovito.io import import_file, export_file
from ovito.modifiers import CoordinationAnalysisModifier, TimeAveragingModifier

from matplotlib import pyplot as plt
import numpy as np
import os


def get_data(strj_path: str, partial=False):
    pipeline = import_file(strj_path)

    modifier = CoordinationAnalysisModifier(cutoff=6, number_of_bins=200, partial=partial)

    pipeline.modifiers.append(modifier)
    pipeline.modifiers.append(TimeAveragingModifier(operate_on='table:coordination-rdf'))

    export_file(pipeline, "rdf.txt", "txt/table", key="coordination-rdf[average]")

    with open('./rdf.txt', 'r') as f:
        lines = f.readlines()
        title = lines[1]
        lines = lines[2:]
    lines = [i.split() for i in lines]
    datas = np.array(lines)
    datas = datas.astype(float)

    labels = title.split('"')[-1].split()

    os.remove('./rdf.txt')

    # sort
    labels = ["-".join(sorted(i.split('-'))) for i in labels]
    sorts = sorted(enumerate(labels), key=lambda x: x[1])
    labels = [item[1] for item in sorts]
    sorted_indices = [item[0] for item in sorts]

    datas = datas[:, [0] + [i + 1 for i in sorted_indices]]
    return datas, labels


def is_in(nplot: list, label: str):
    for i in nplot:
        if i in label:
            return True
    return False


if __name__ == '__main__':
    cm = plt.colormaps['Paired']

    # get rdf
    datas_vasp, labels_vasp = get_data('/Users/spook/Desktop/h2o/XDATCAR')
    datas_ml, labels_ml = get_data('/Users/spook/Desktop/h2o/A.lammpstrj661')

    # plot rdf -------------------------------------------------------------------
    fig = plt.figure(figsize=(4, 3), dpi=200)
    ax = fig.add_subplot()

    ax.plot(datas_vasp[:, 0], datas_vasp[:, 1], label="DFT")
    ax.plot(datas_ml[:, 0], datas_ml[:, 1], linestyle="--", c='r', label="ACNN")

    ax.set_xlabel('r')
    ax.set_ylabel('g(r)')
    ax.set_title('RDF')

    y_lim = ax.get_ylim()
    ax.set_ylim(y_lim[0], 10)

    ax.legend()
    # rdf plot end  --------------------------------------------------------------

    #

    #

    #

    """
    1. get partial rdf
    2. plot partial rdf.    The `include (list)`  denote the elements or bonds to be plot.
                            eg: ["H"] plot all bonds contain "H" atoms.
                                ["H-O"] plot "H-O" rdf only.
                                ["Ti", "H-O"] plot "Ti" rdf adding "H-O"
    """
    # get partial rdf
    datas_vasp, labels_vasp = get_data('/Users/spook/Desktop/h2o/XDATCAR', partial=True)
    datas_ml, labels_ml = get_data('/Users/spook/Desktop/h2o/A.lammpstrj661', partial=True)

    # plot partial rdf -----------------------------------------------------------
    include = ['Ti']
    include = ["-".join(sorted(i.split('-'))) for i in include]

    fig = plt.figure(figsize=(6, 4), dpi=200)
    ax = fig.add_subplot()

    for i in range(len(labels_vasp)):
        if is_in(include, labels_vasp[i]):
            ax.plot(datas_vasp[:, 0], datas_vasp[:, 1 + i], c=cm.colors[i], label="DFT " + labels_vasp[i], linewidth=1)

    for i in range(len(labels_ml)):
        if is_in(include, labels_ml[i]):
            ax.plot(datas_ml[:, 0], datas_ml[:, 1 + i], c=cm.colors[i], label="ACNN " + labels_ml[i], linestyle="--",
                    linewidth=2)

    ax.set_xlabel('r')
    ax.set_ylabel('g(r)')
    ax.set_title('RDF  ' + " ".join(include))

    ax.legend(ncol=2, prop={'size': 8})
转载请注明来源 有问题可通过github提交issue